
Introduction
Claude Code is a powerful AI coding assistant that can help you with various development tasks. It support telemetry monitoring, so I thought it would be fun to set up a .NET Aspire dashboard to visualize my usage and see how claude operates under the hood.
Source code: github.com/NikiforovAll/claude-code-rules
Setting Up .NET Aspire Dashboard
The first step is to run the Aspire dashboard. You can do this easily with Podman or Docker:
podman run --rm -it -d \
    -p 18888:18888 \
    -p 4317:18889 \
    --name aspire-dashboard \
    mcr.microsoft.com/dotnet/aspire-dashboard
This command starts the Aspire dashboard with the following configuration:
- Dashboard UI accessible at port 18888
- OpenTelemetry collector at port 4317
Configuring Claude Code Telemetry
Next, we need to configure Claude Code to send telemetry data to our Aspire dashboard. This is done through environment variables.
Create an .env file with the following content:
export CLAUDE_CODE_ENABLE_TELEMETRY=1
export OTEL_LOG_USER_PROMPTS=1
export OTEL_EXPORTER_OTLP_ENDPOINT=http://localhost:4317
export OTEL_EXPORTER_OTLP_PROTOCOL=grpc

export OTEL_LOGS_EXPORTER=otlp
export OTEL_LOGS_EXPORT_INTERVAL=5000

export OTEL_EXPORTER_OTLP_METRICS_PROTOCOL=grpc
export OTEL_METRICS_EXPORTER=otlp
export OTEL_METRIC_EXPORT_INTERVAL=10000

export OTEL_SERVICE_NAME=claude-code
export OTEL_RESOURCE_ATTRIBUTES=service.instance.id=nikiforovall
Then load these environment variables in your terminal:
export $(grep -v '^#' .env | xargs)
See Monitoring Usage for more details on how to configure telemetry for Claude Code.
Using the Dashboard
With everything set up, you can now:
- Open your browser and navigate to
http://localhost:18888 - Use Claude Code as you normally would
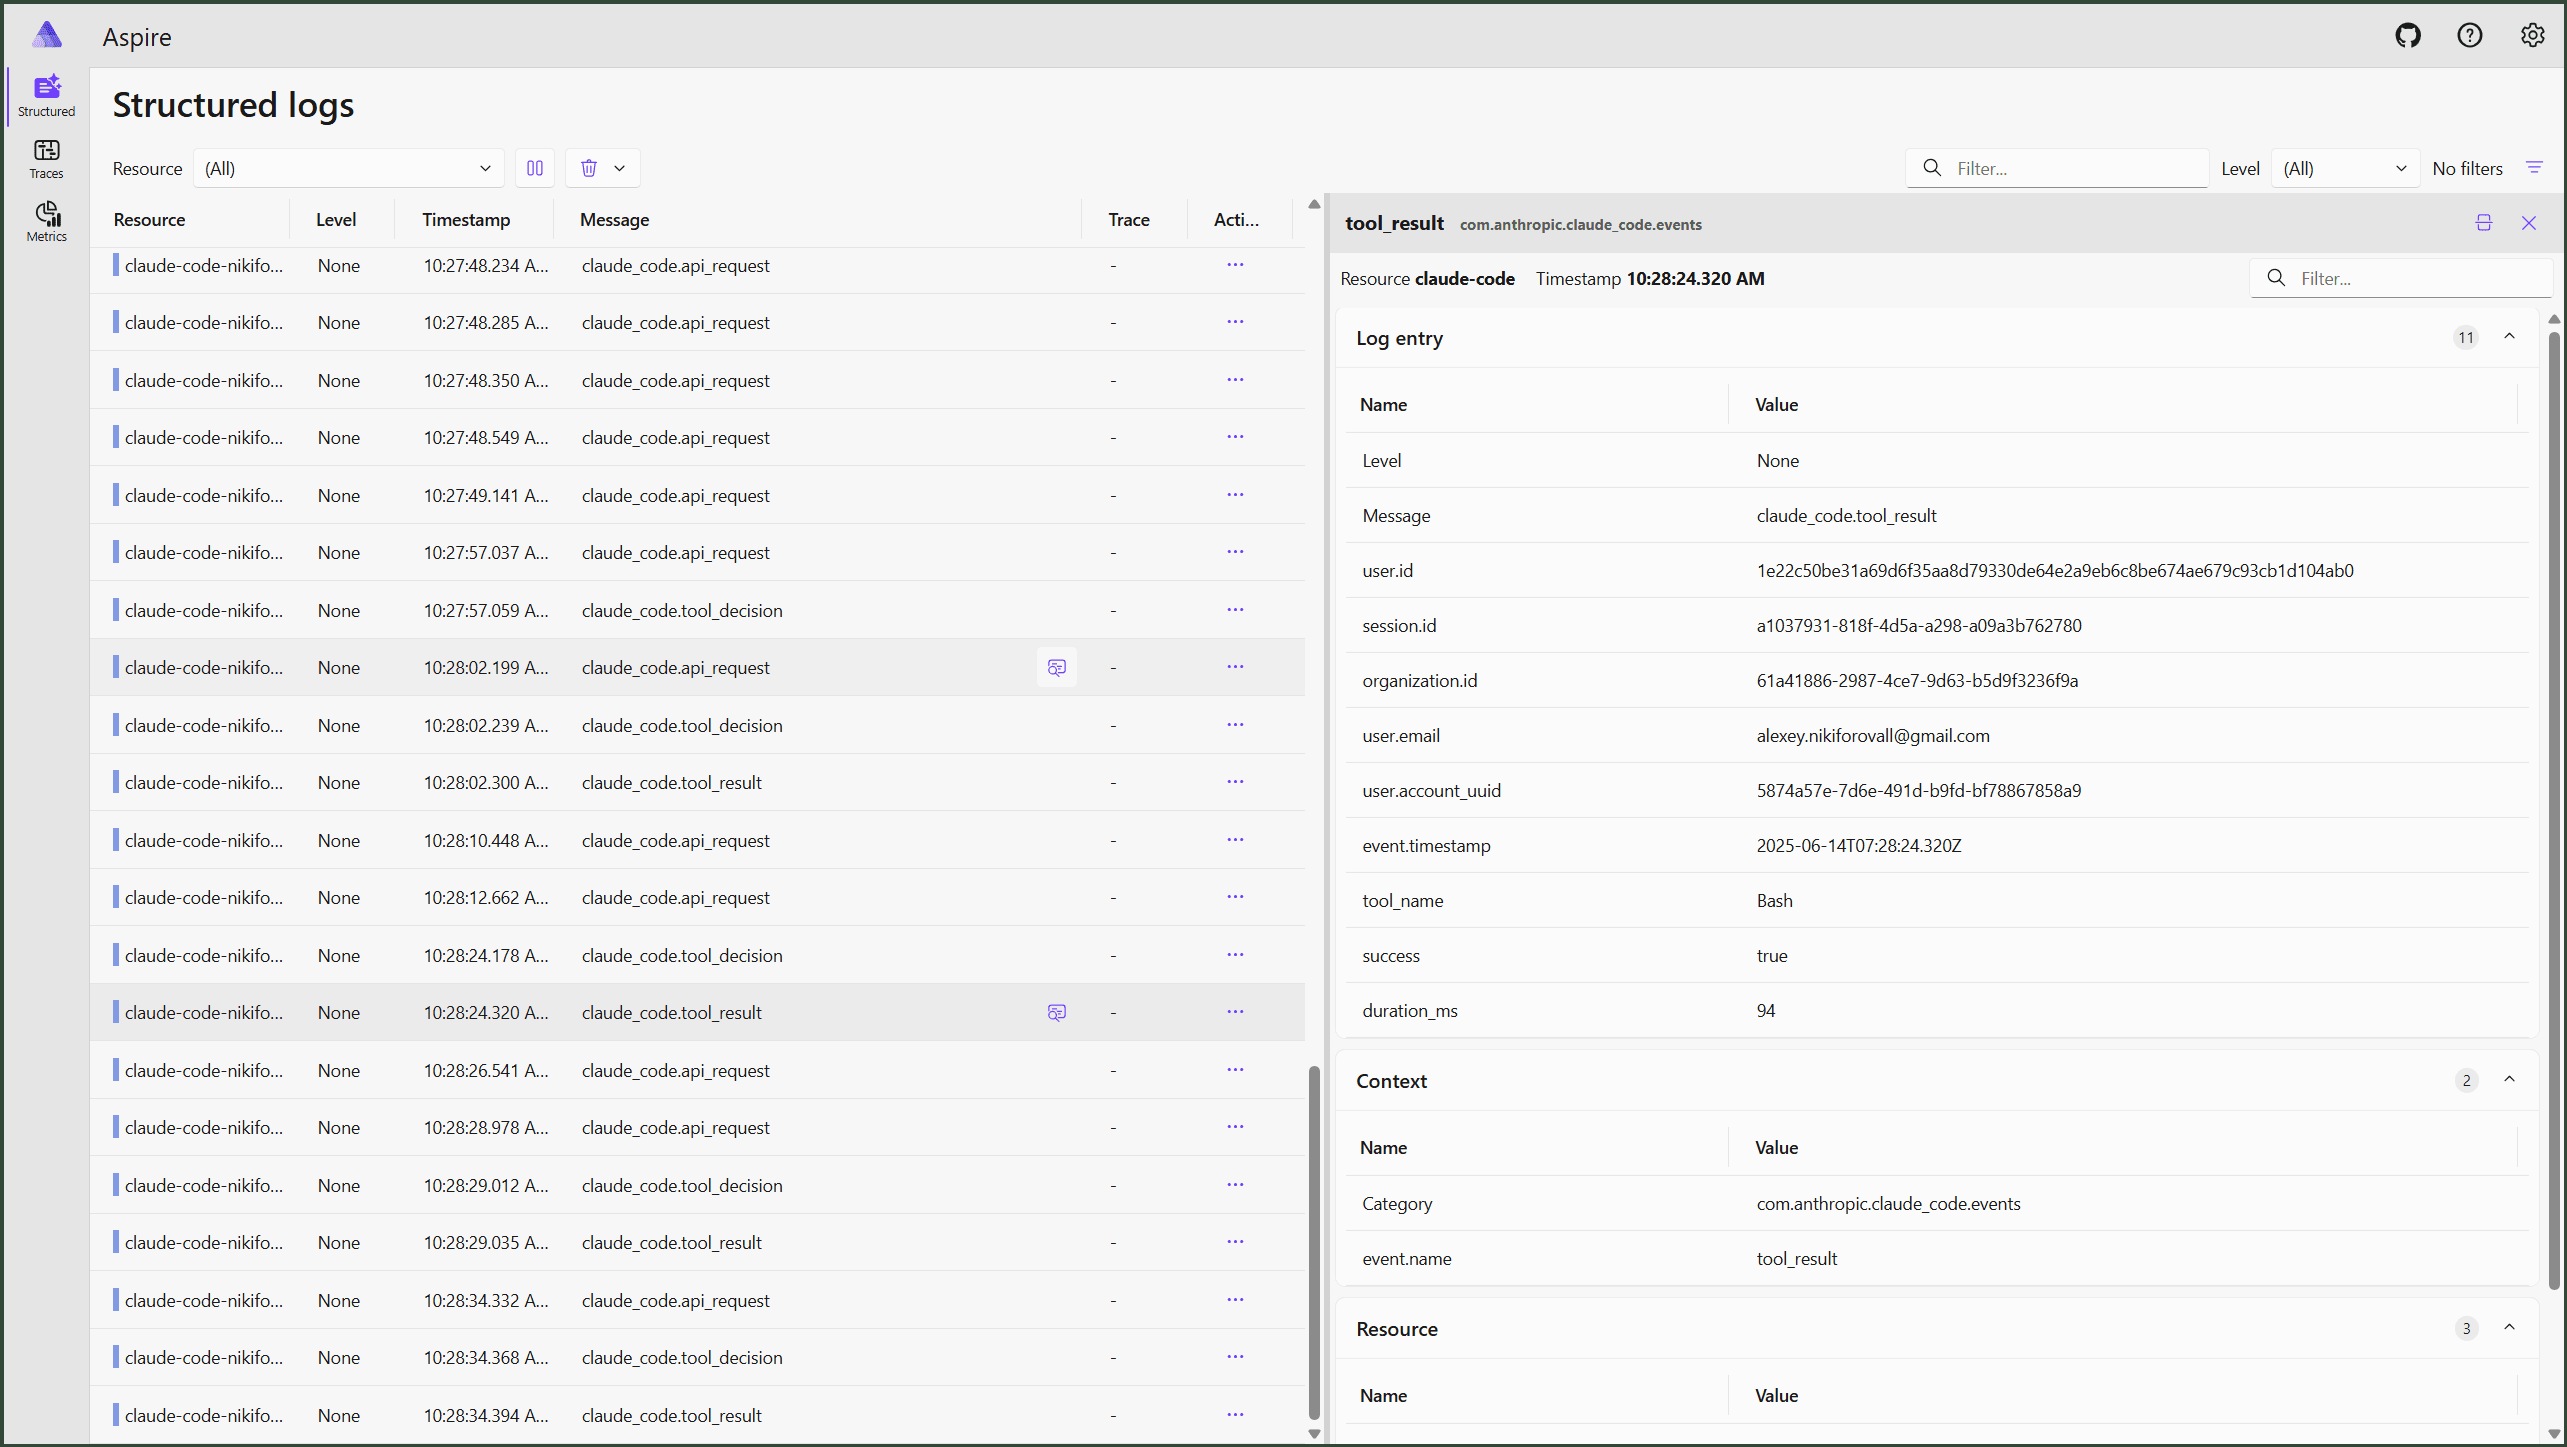
- Watch as telemetry data appears in the Aspire dashboard
The dashboard will show various metrics and logs that can help you understand:
- What kind of models and tools are being used
- How often Claude Code is invoked
- What prompts are being sent
- Token usage patterns
- Any errors or issues that occur
Benefits of Monitoring
Setting up telemetry monitoring for Claude Code offers several advantages:
- Usage Insights: Understand how Claude Code performs in real-world scenarios.
- Resource Management: Monitor token usage and adjust your subscription if necessary.
- Topics:
- productivity (15) ·
- productivity (13) ·
- ai (32) ·
- claude (8) ·
- agents (17) ·
- aspire (23) ·
- opentelemetry (7)
