pi-otel user guide
A walkthrough of installation, the /otel command, and what you see in the dashboard. For the full config reference, see Configuration. For connecting other backends, see Backends.
Installation
pi install npm:pi-otelpi-otel is a pi package — it loads automatically on the next session start.
Quickstart
/otel startThis spawns a local .NET Aspire dashboard and opens it at http://localhost:18888. The dashboard receives traces over OTLP gRPC on port 4317.
Backend auto-detection order: Aspire CLI → Docker → Podman. Install at least one:
- Aspire CLI —
irm https://aspire.dev/install.ps1 | iex(Windows) orcurl -sSL https://aspire.dev/install.sh | bash - Docker or Podman — any recent version
Force a specific backend with --driver=:
/otel start --driver=dockerSlash commands
| Command | What it does |
|---|---|
/otel start | Spawn the local Aspire dashboard (auto-detects backend) |
/otel start --driver=<aspire|docker|podman> | Force a specific backend |
/otel stop | Stop the dashboard process |
/otel connect <endpoint> | Point pi-otel at an existing OTLP endpoint and restart the SDK |
What you see in Aspire
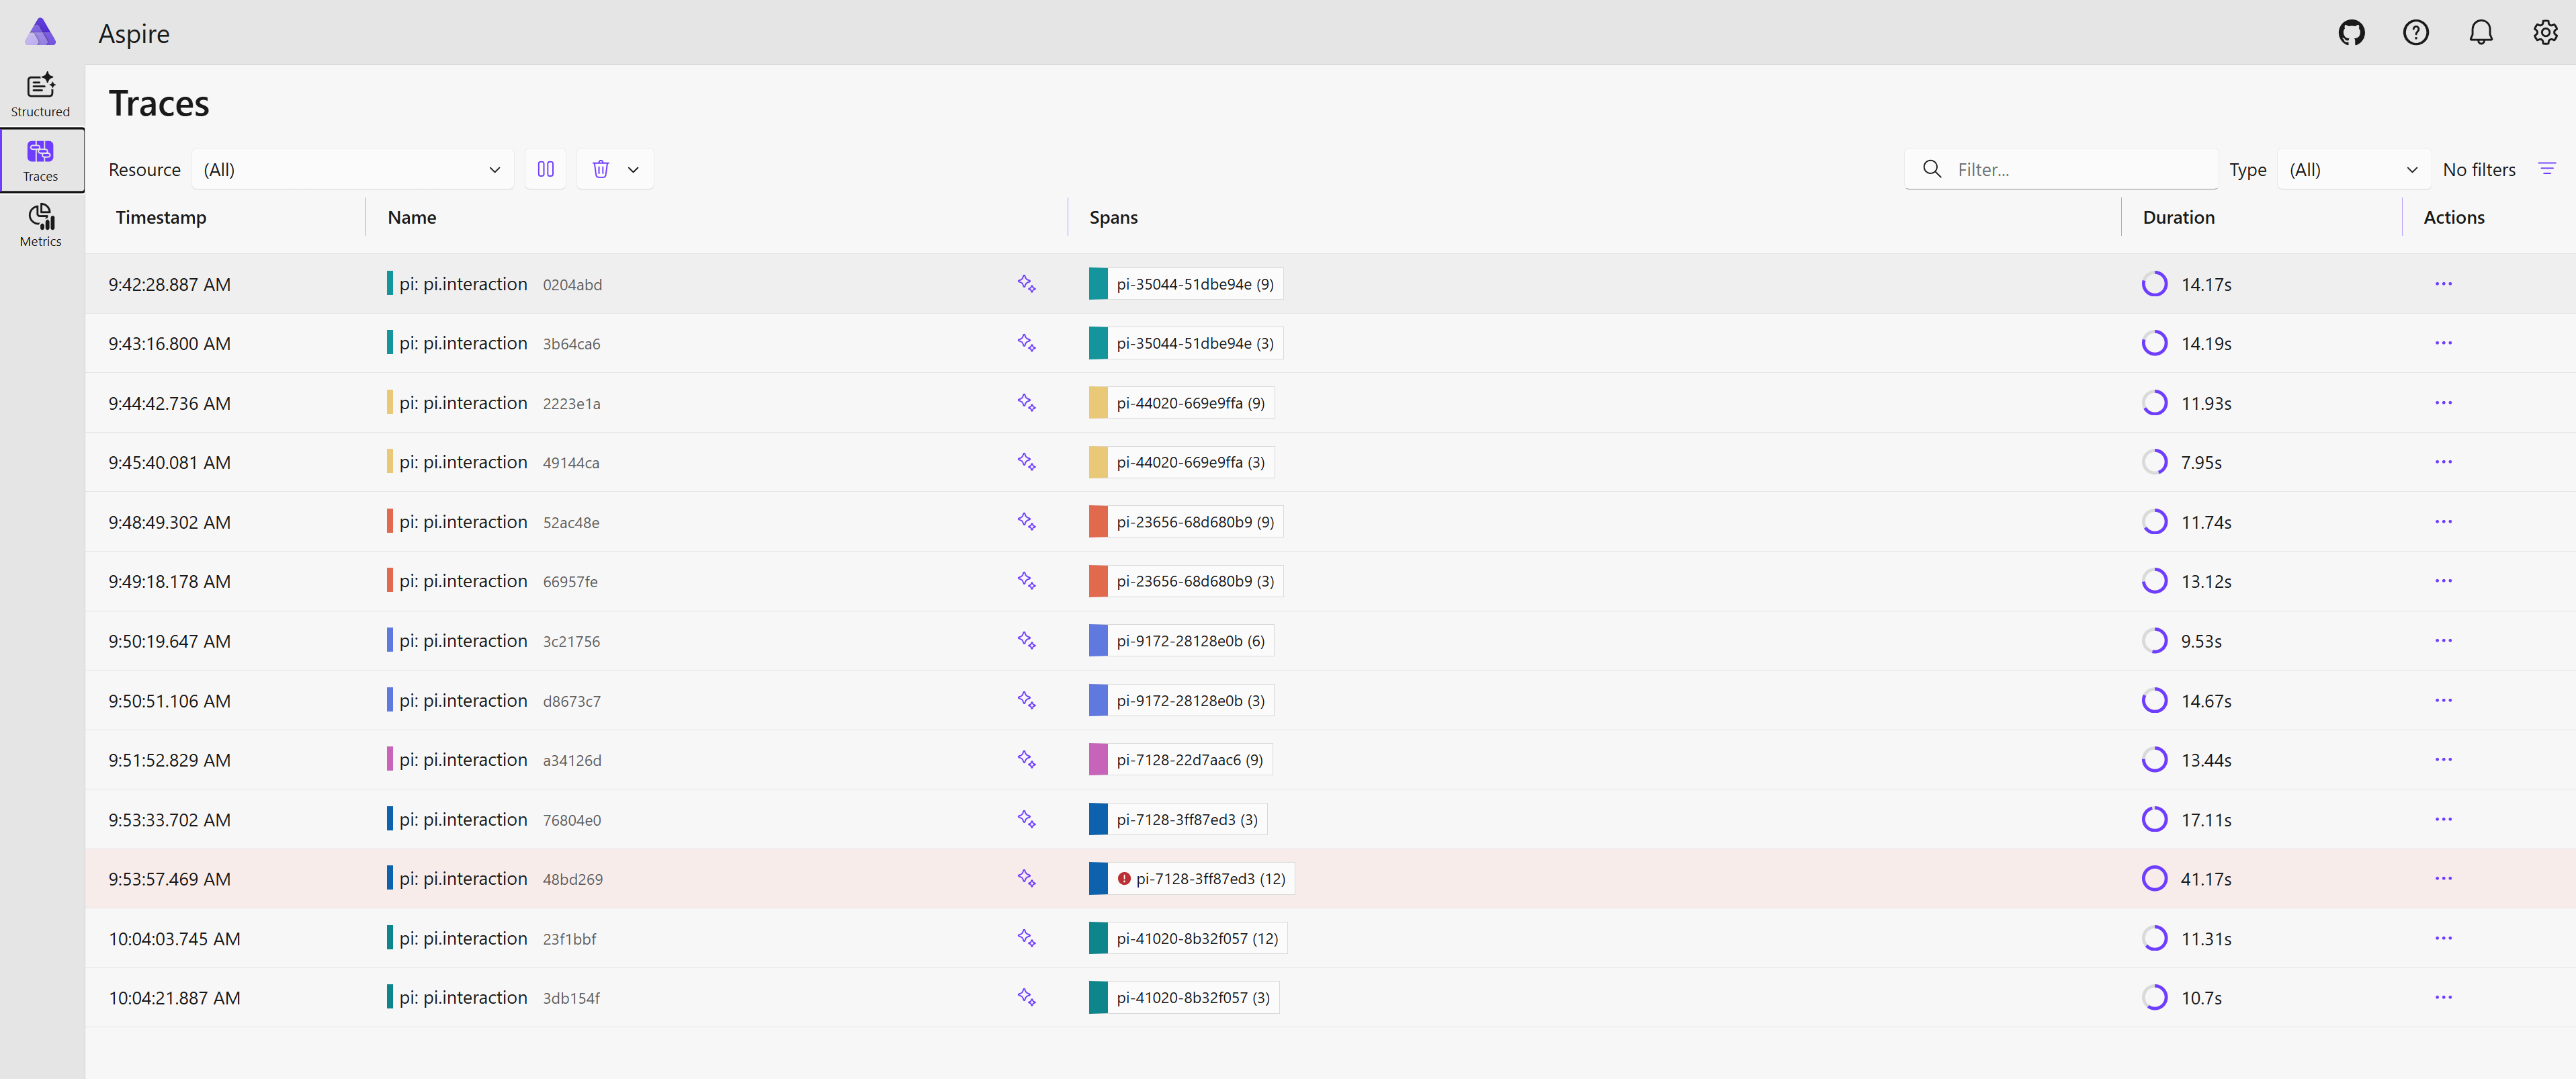
Traces tab — one root span (pi.interaction) per user prompt. Expand it to see:
pi.turn— one per agent turn (if enabled)pi.llm_request— the LLM call with token counts, model, finish reason, and full message content (whencaptureContentisfull)pi.tool.<name>— one span per tool execution, with input/output and error status
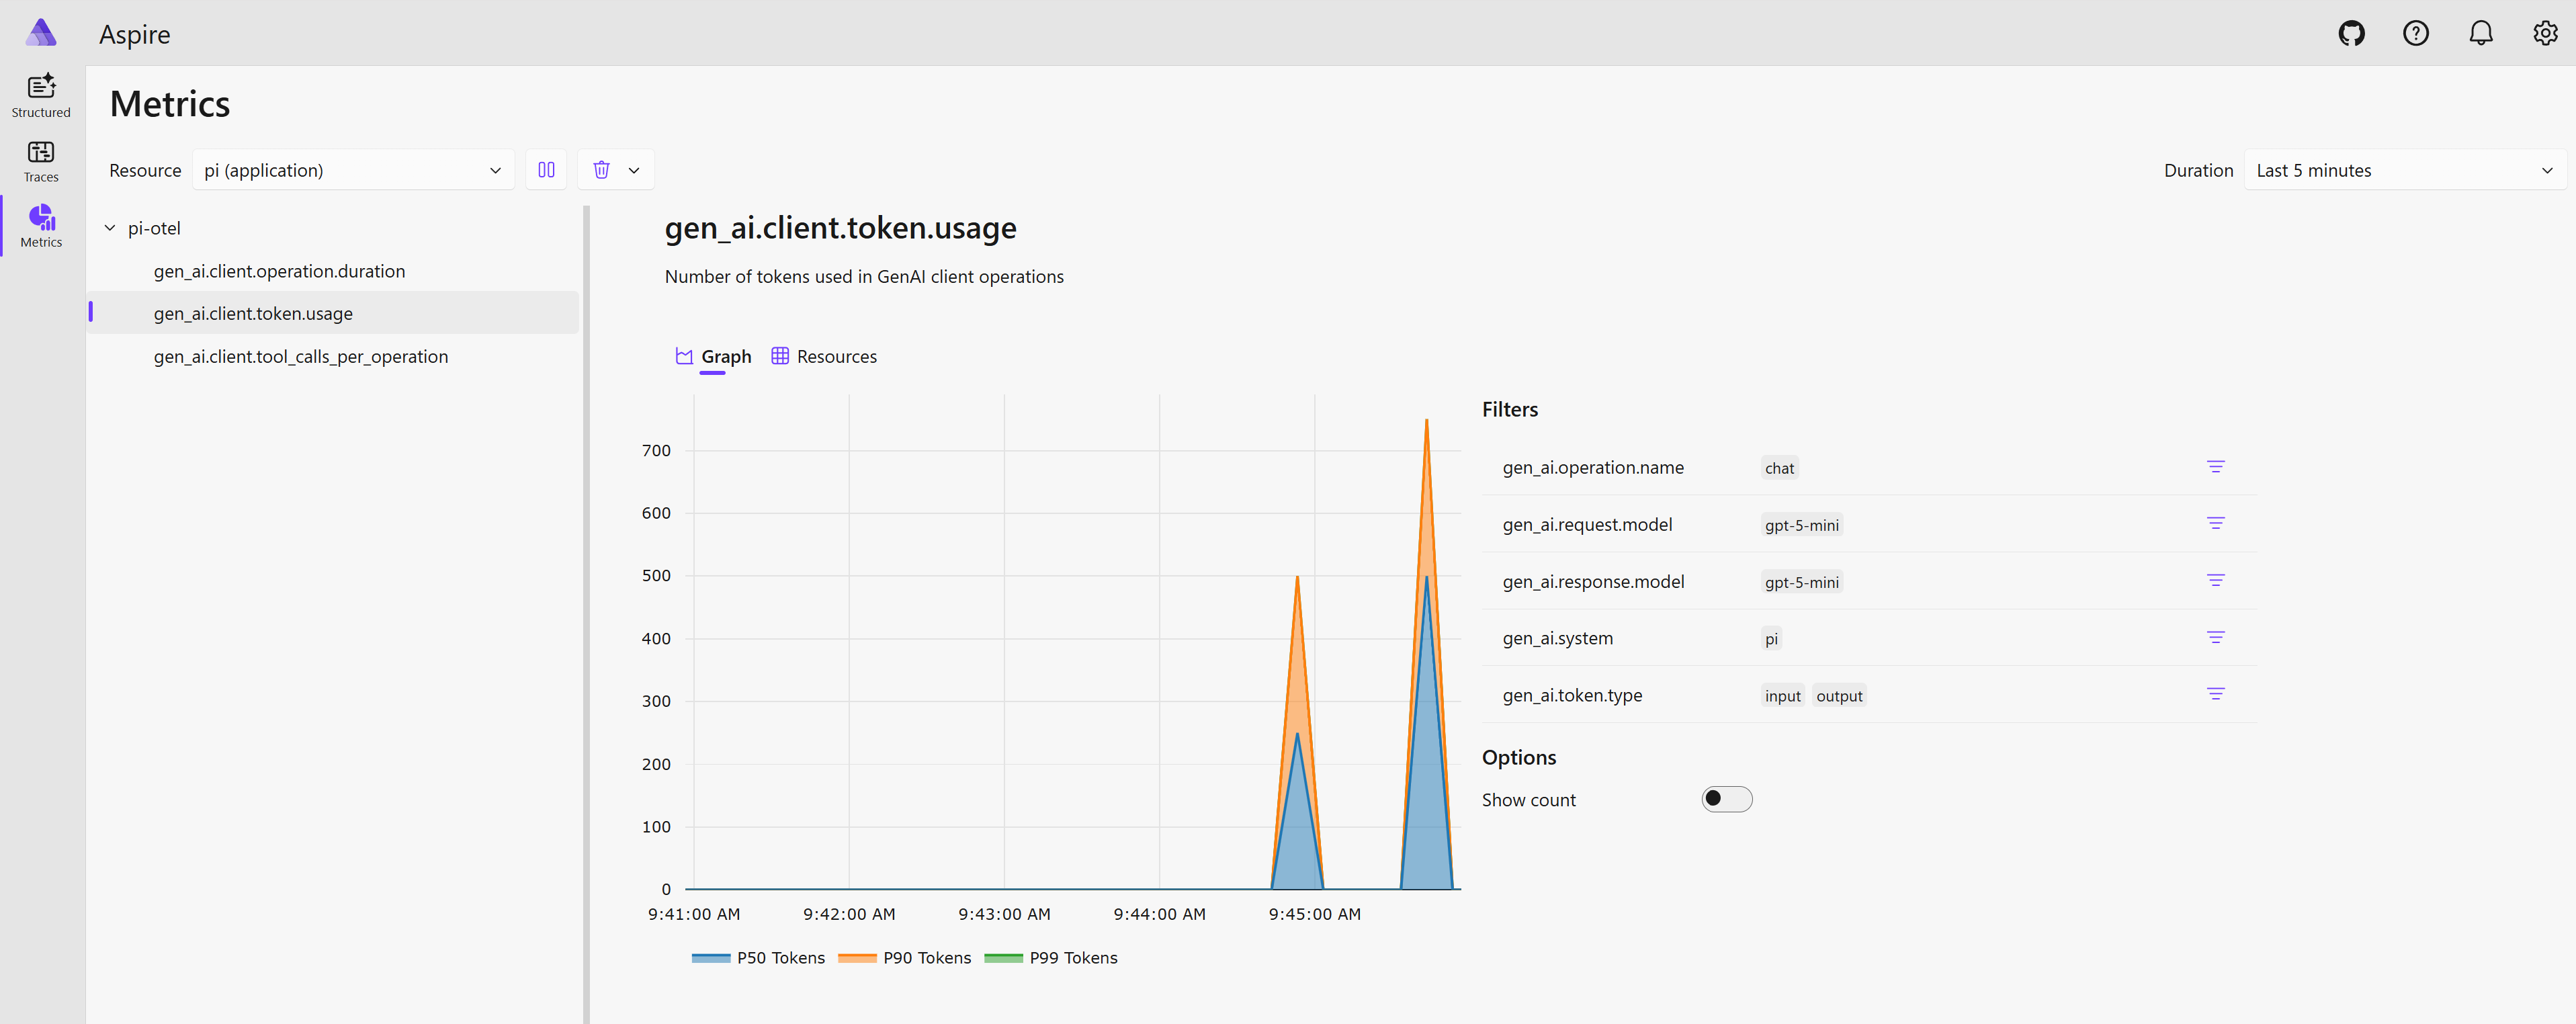
Metrics tab — when signals.metrics is enabled:
gen_ai.client.operation.duration— LLM request latency histogram, by model and operationgen_ai.client.token.usage— input / output / cache token histogramgen_ai.tool.duration— tool execution latency histogram, by tool name
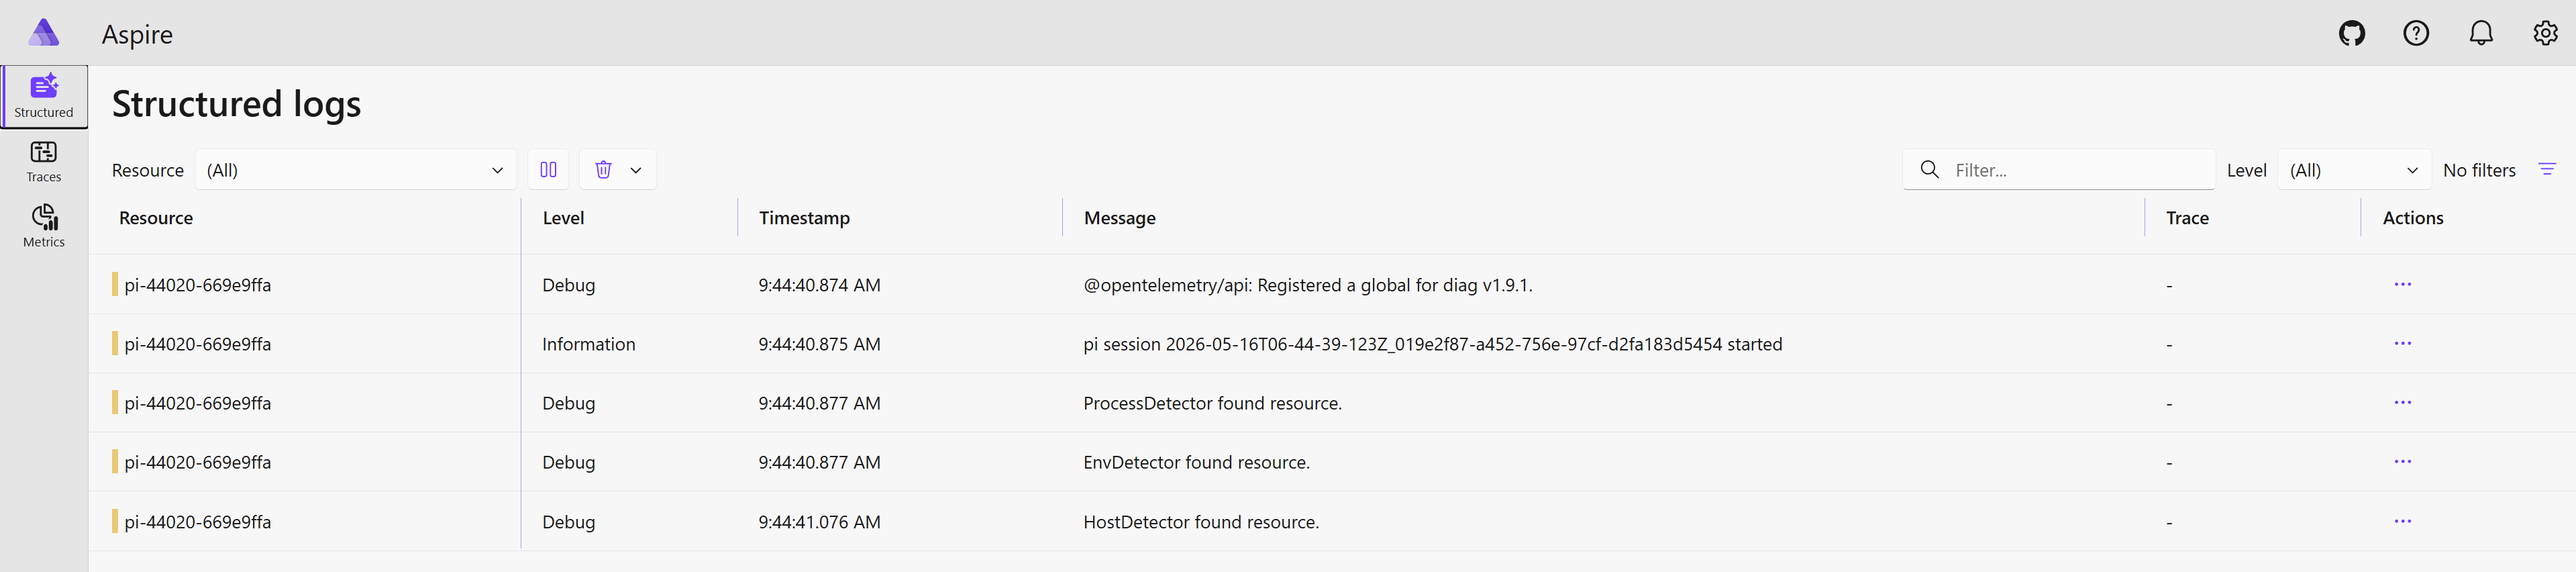
Structured Logs tab — when signals.logs is enabled:
- Lifecycle events:
pi.session.start,pi.session.end,pi.tool.error,pi.llm_request.error - OTel SDK internal diag chatter (filtered, bridged via
@opentelemetry/diag)
Content capture
By default (captureContent: "metadata_only") spans carry token counts, model names, finish reasons, and tool call IDs — but not prompt or response text. Set captureContent: "full" to include message content (capped at 60 KB per attribute). See Configuration for all modes.