
TL;DR: pi-otel is an OpenTelemetry extension for the pi coding agent. It emits one trace tree per user prompt — interaction, turns, LLM requests, and tool calls — over OTLP. The default target is a local .NET Aspire dashboard. Any OTLP-compatible backend (Grafana LGTM, Jaeger, Honeycomb) works too. Install with pi install npm:pi-otel, start with /otel start.
Docs: nikiforovall.blog/pi-otel/
Why telemetry for a coding agent?
Pi is deliberately minimal. That minimalism is a feature — but it means there’s no built-in timeline view of what the agent actually did. You can read the session log, but a log is not a trace. You can count tokens from the session info modal, but a histogram is not a counter.
Honestly, the first reason to install it is just curiosity. Watching a span tree populate in real time — seeing exactly which tool ran, how long it took, what the model returned — is a different kind of understanding than reading a session log after the fact. If you’ve ever wondered what pi is actually doing under the hood, a trace will show you in a way that no amount of log-reading will.
If you’re running pi in a CI pipeline or as part of a larger workflow, “it worked or it didn’t” is not enough. You want to know which tool call ate 40 seconds, why a particular prompt costs twice as much as others, and whether errors cluster around a specific model or tool. That’s what spans give you.
What it emits
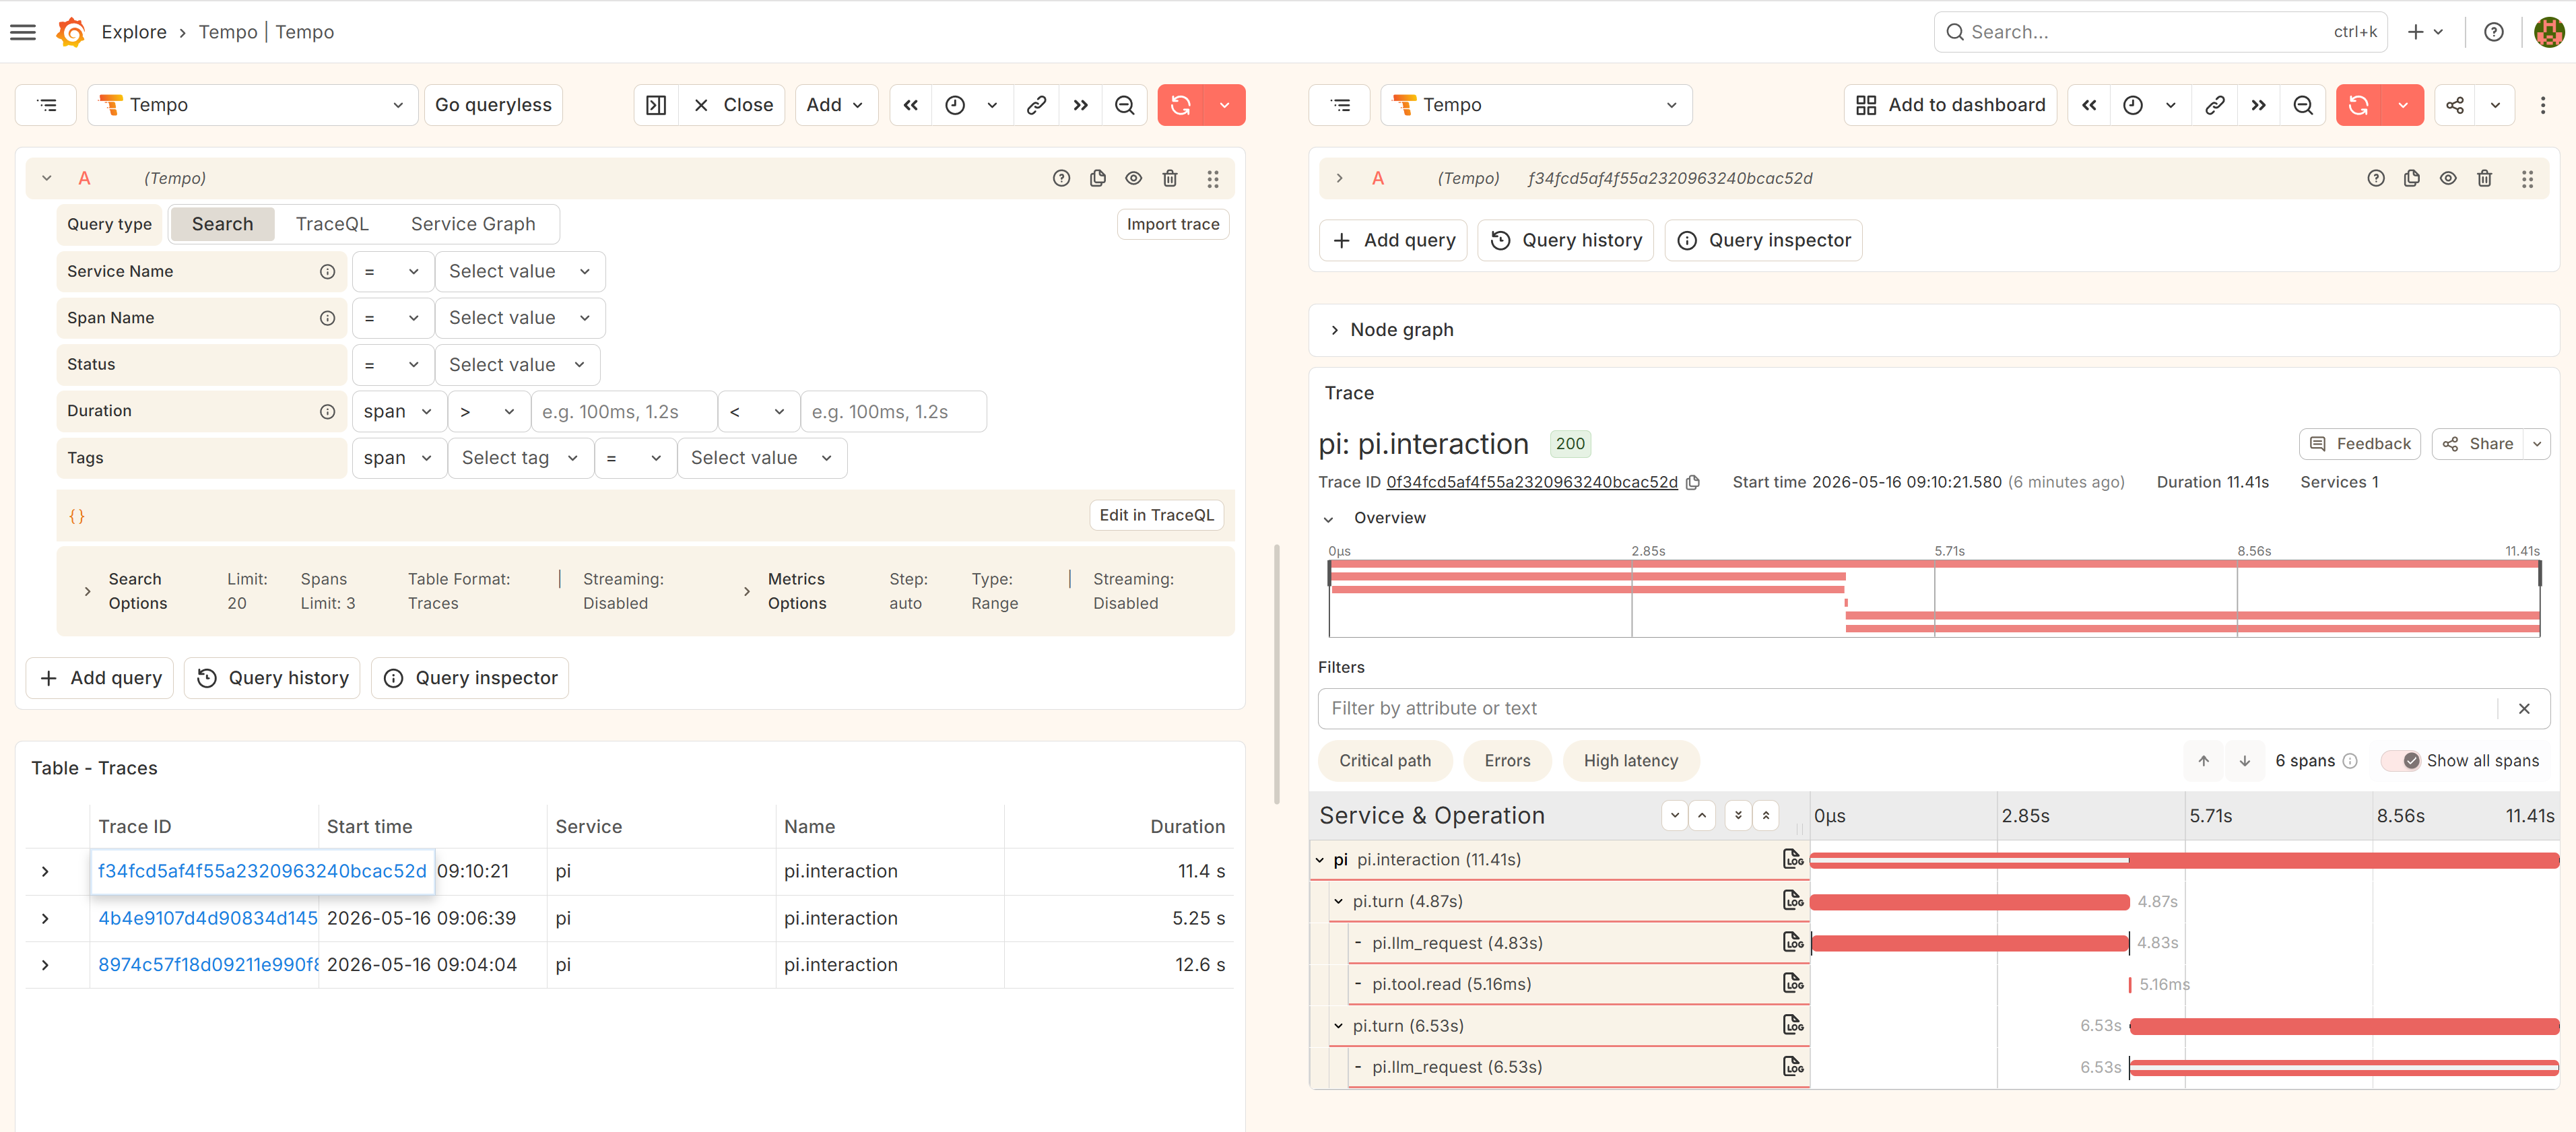
One trace tree per user prompt:
pi.interaction                      ← root span (one per turn)
└── pi.turn                         ← one per agent turn
    ├── pi.llm_request              ← the LLM call
    └── pi.tool.<name>              ← one per tool execution
Every span carries GenAI semantic convention attributes — gen_ai.system, gen_ai.request.model, gen_ai.usage.input_tokens, gen_ai.usage.output_tokens, finish reason, tool call IDs, and gen_ai.conversation.id to correlate spans across a session.
The session is intentionally not a span. A pi session can run for hours; long-running root spans are an OTel anti-pattern. Instead, session identity travels as attributes on every span.
Quickstart
pi install npm:pi-otel
Then inside pi:
/otel start
That’s it. pi-otel auto-detects an OTLP backend in this order: Aspire CLI → Docker → Podman. It spawns a local .NET Aspire dashboard and opens it at http://localhost:18888.
Backend install options:
-
Aspire CLI —
irm https://aspire.dev/install.ps1 | iex(Windows) orcurl -sSL https://aspire.dev/install.sh | bash - Docker or Podman — any recent version
What you see in Aspire
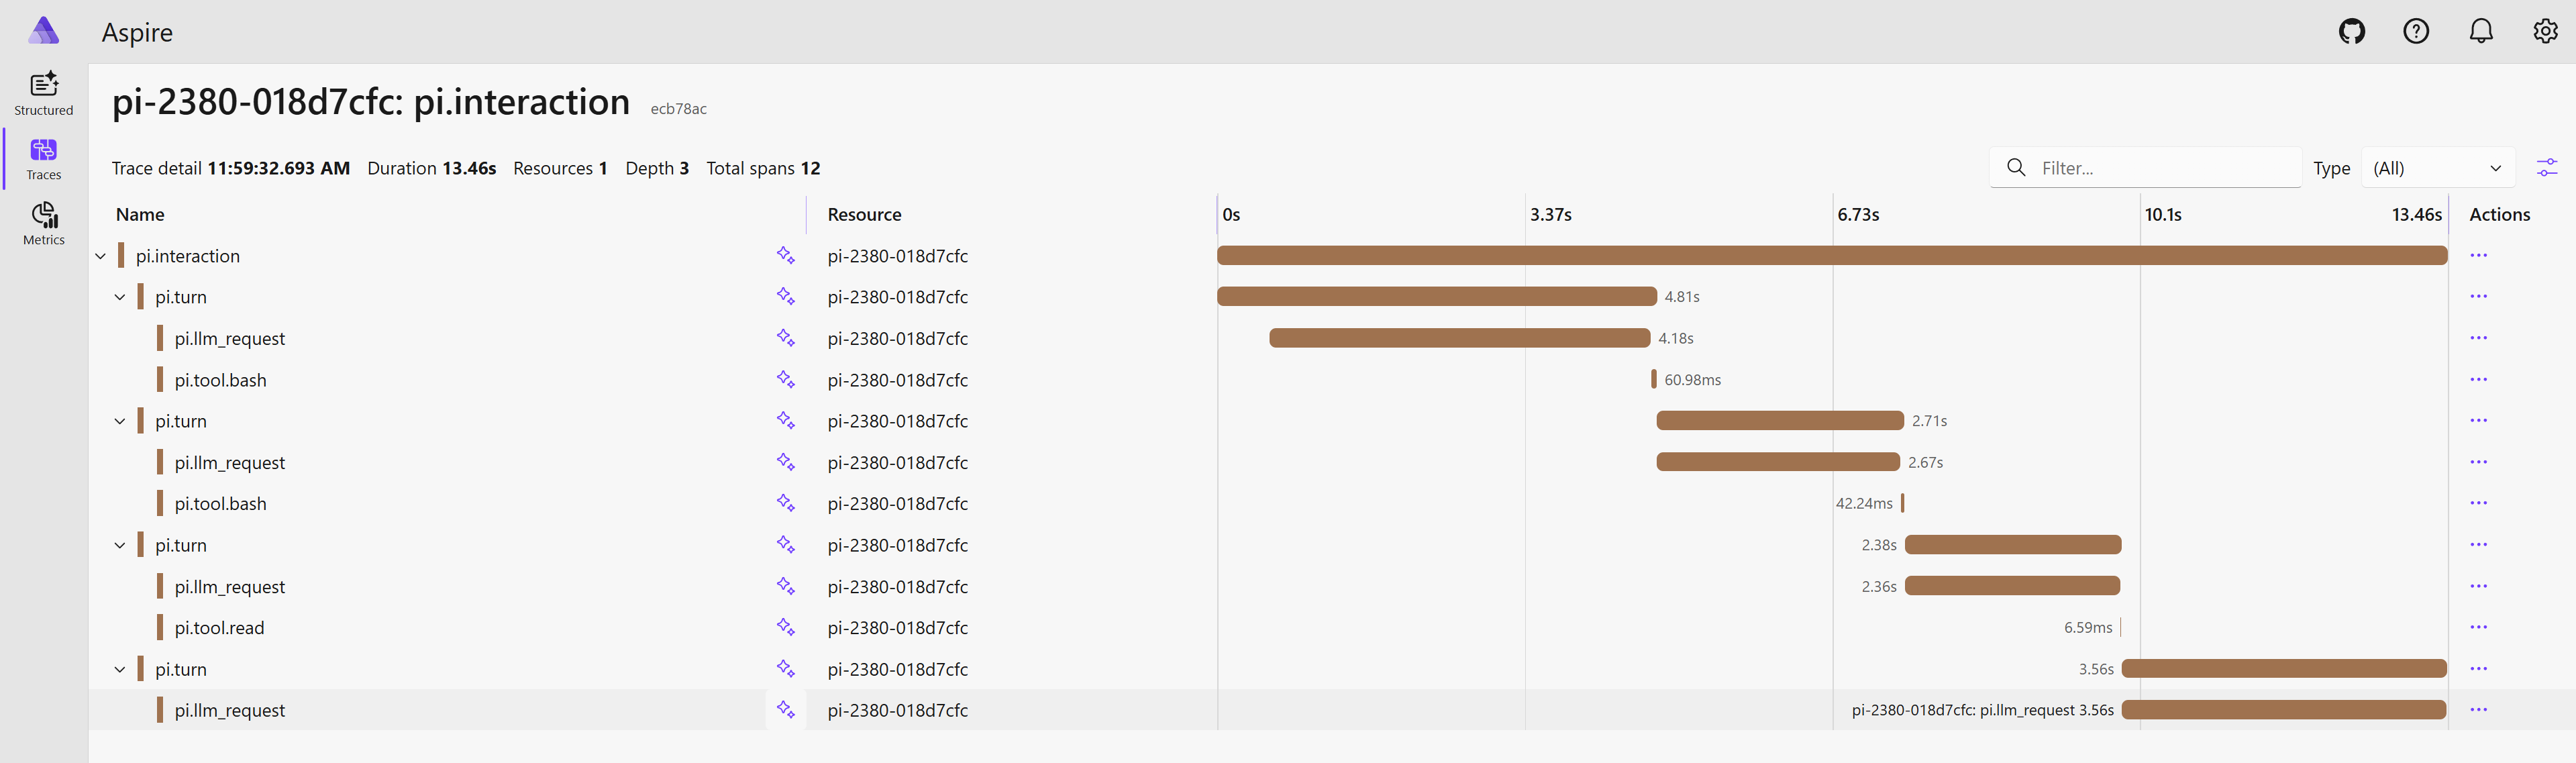
The Traces tab shows one root span per user prompt. Expand to see the full turn → LLM request → tool call nesting. Click any span for the attribute panel: model, token counts, finish reason, tool input/output.
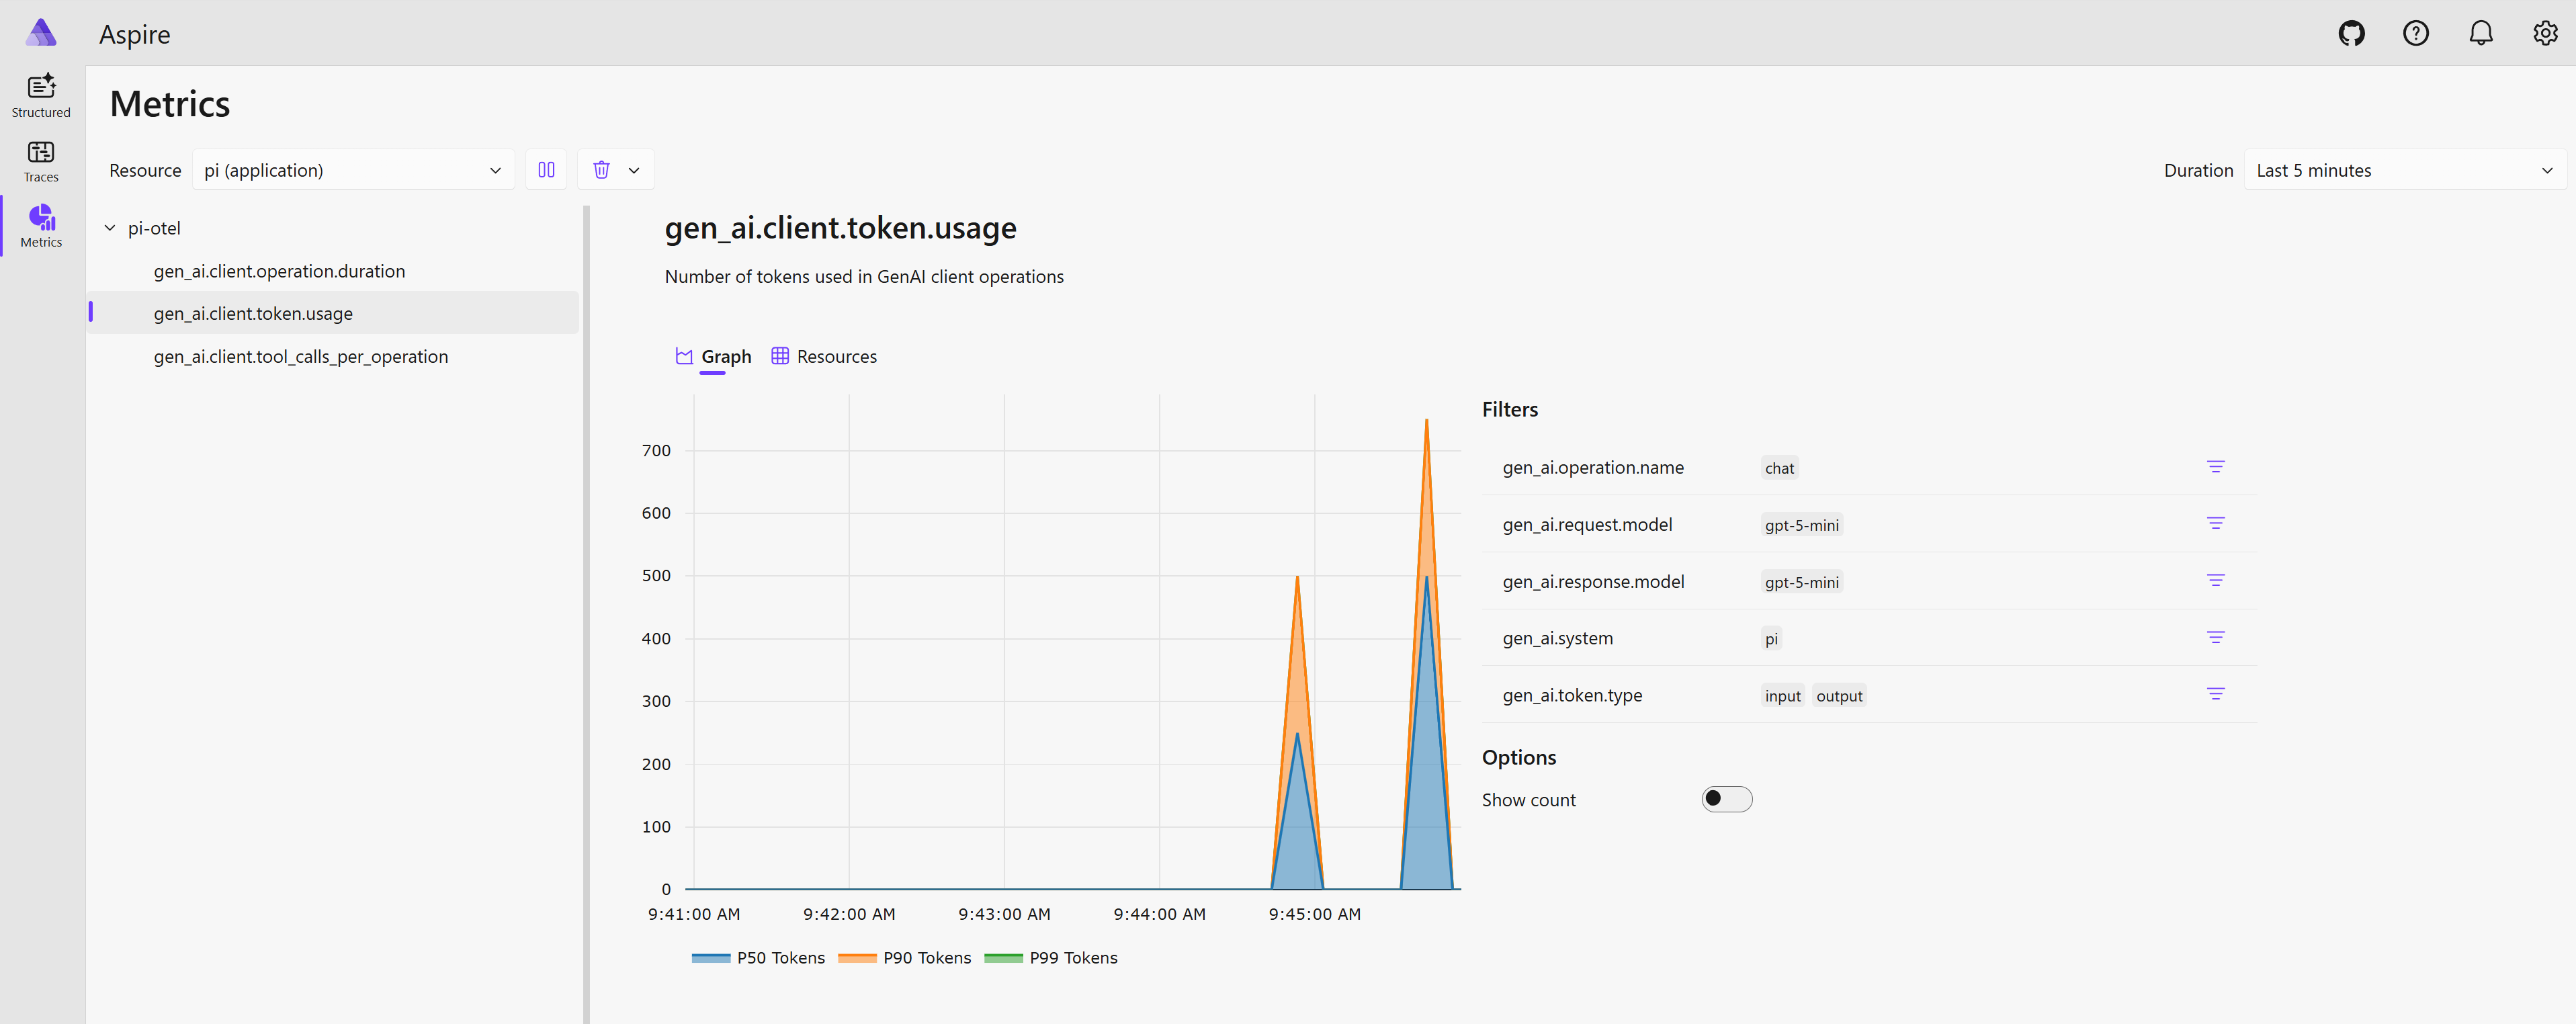
The Metrics tab (enabled with "signals": { "metrics": true }) shows histograms for LLM request latency, token usage (input/output/cache), and tool execution time.
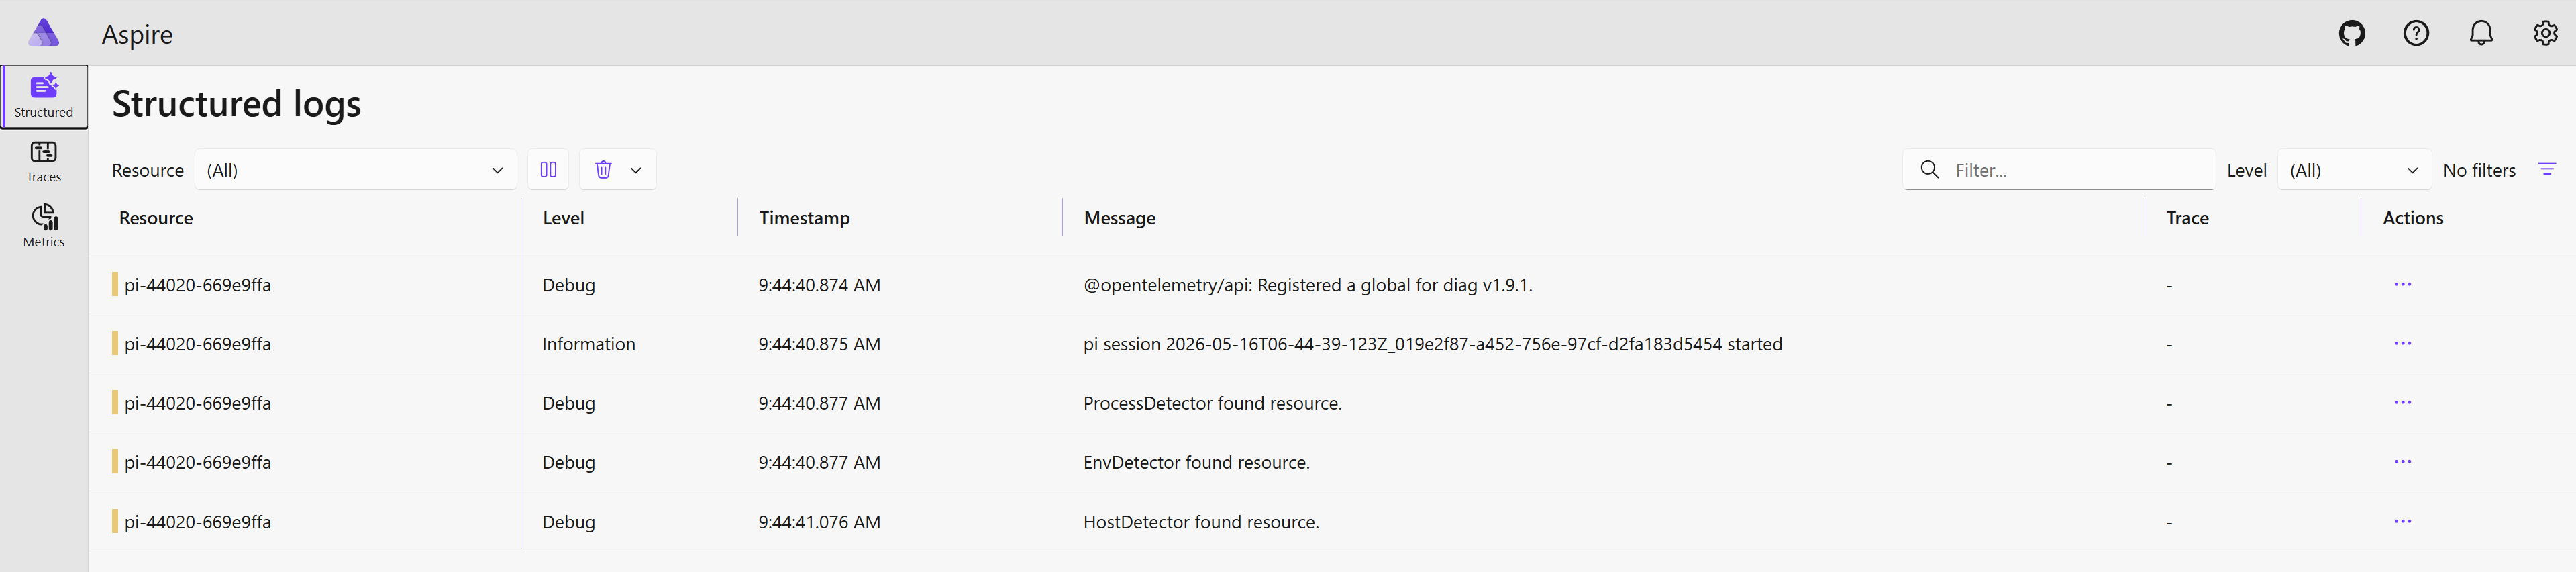
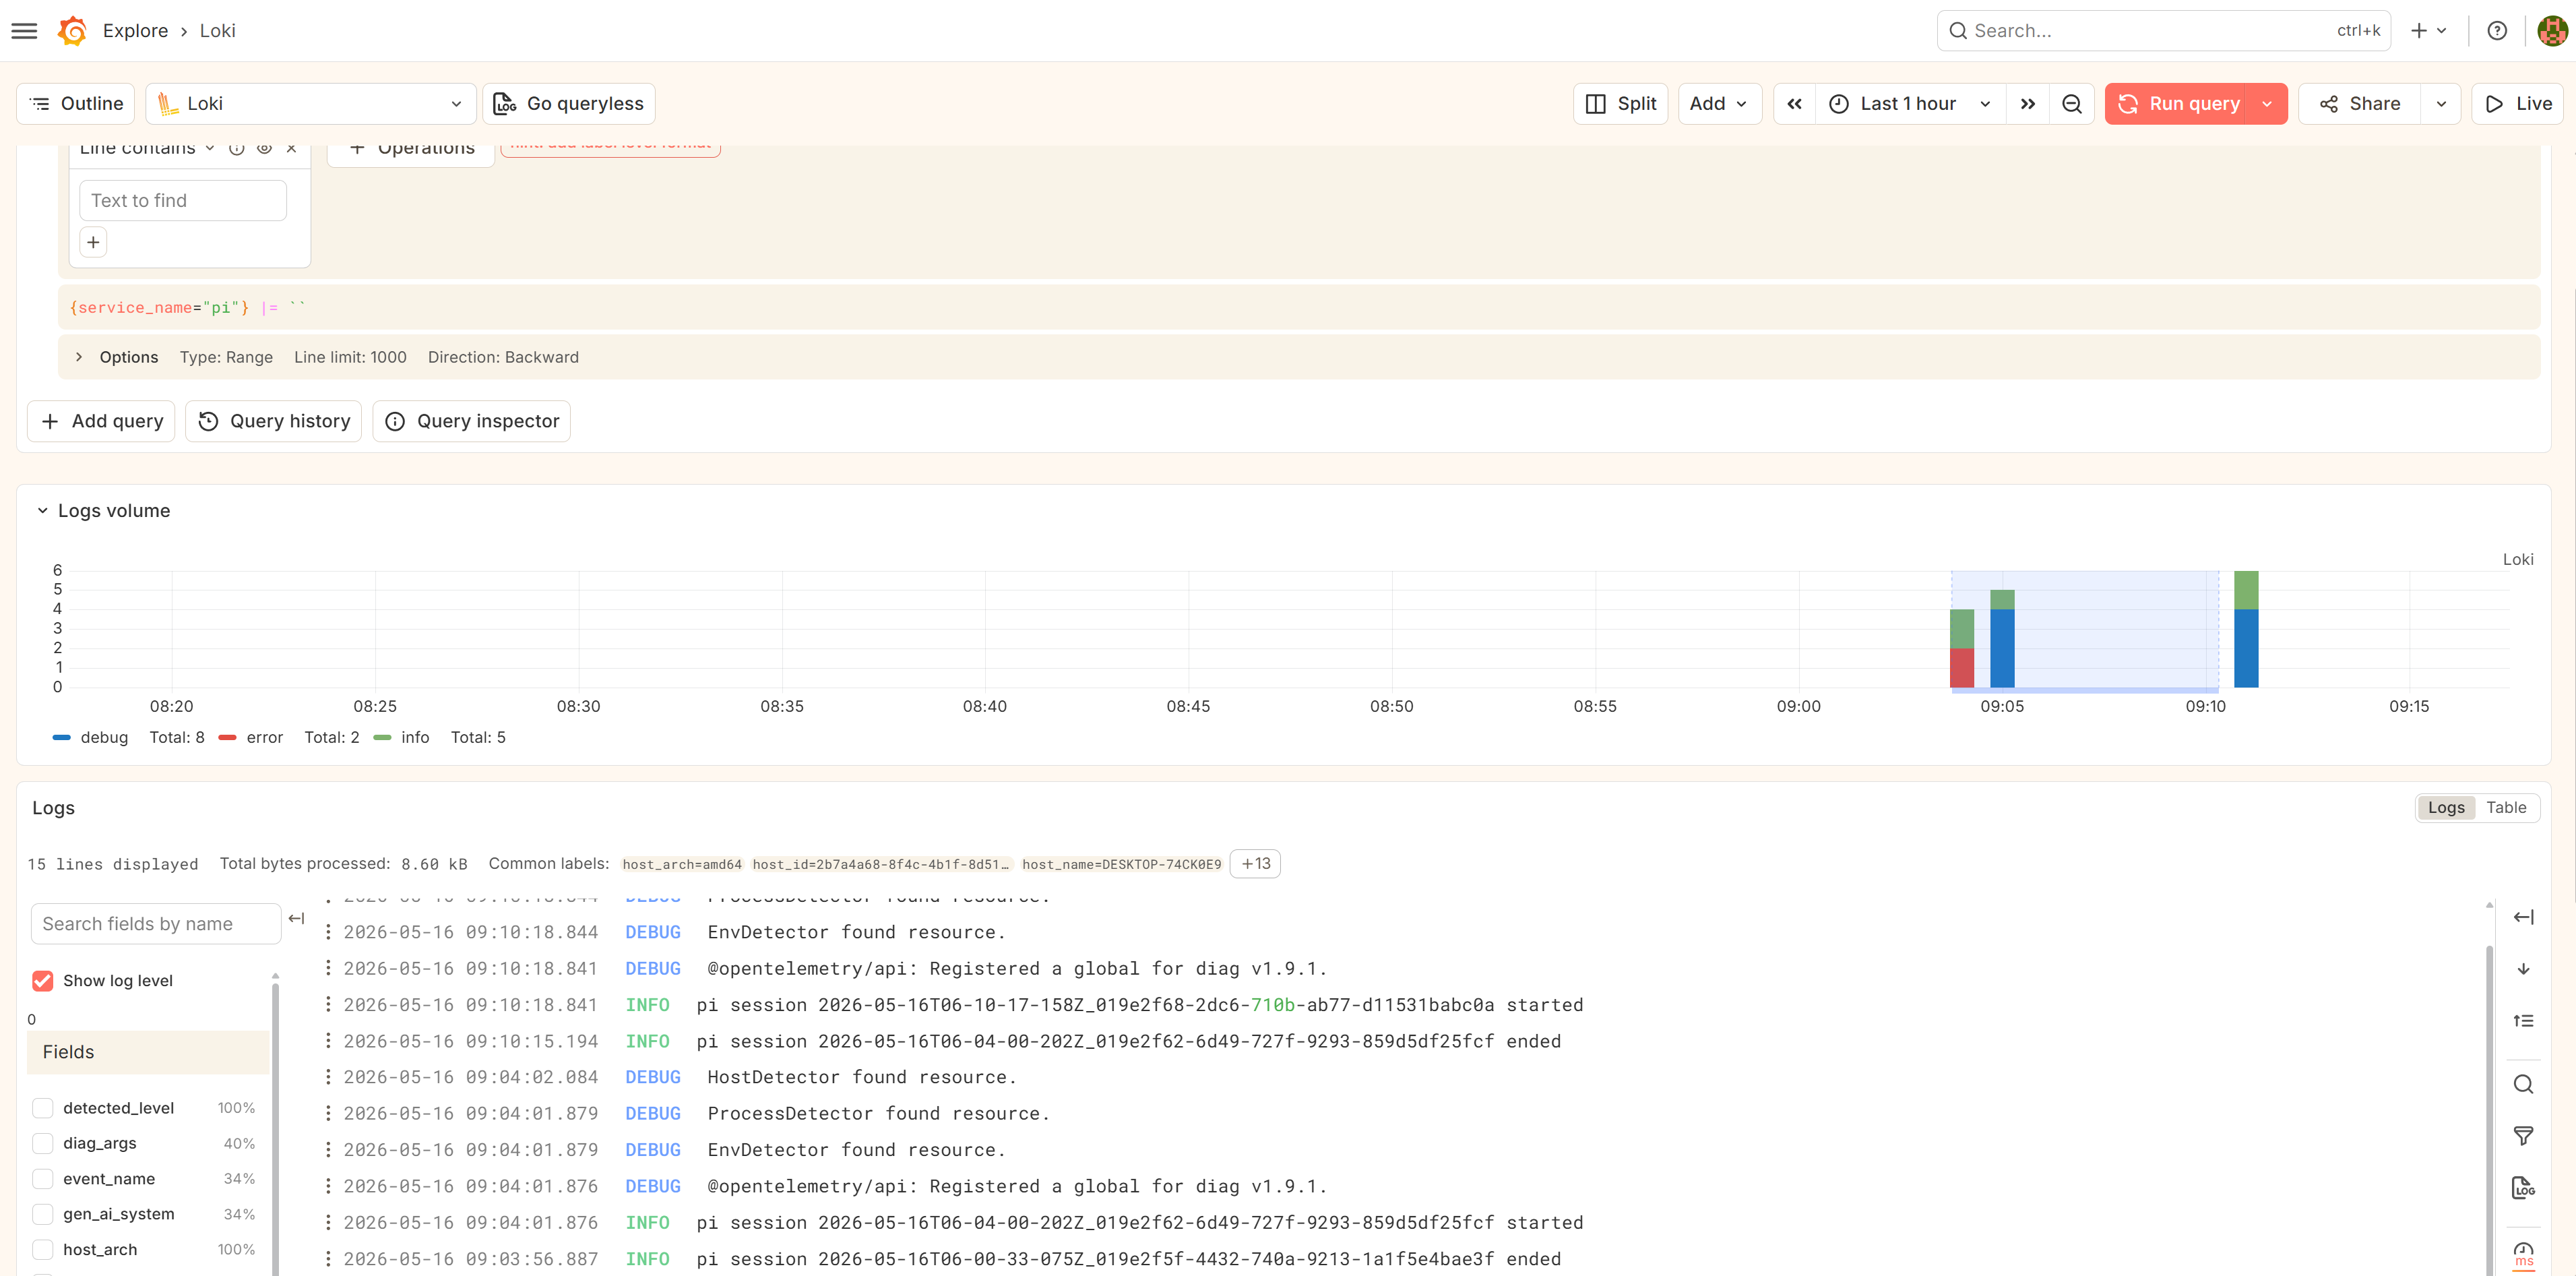
The Structured Logs tab (enabled with "signals": { "logs": true }) surfaces lifecycle events — pi.session.start, pi.session.end, pi.tool.error — plus the filtered OTel SDK diag bridge output.
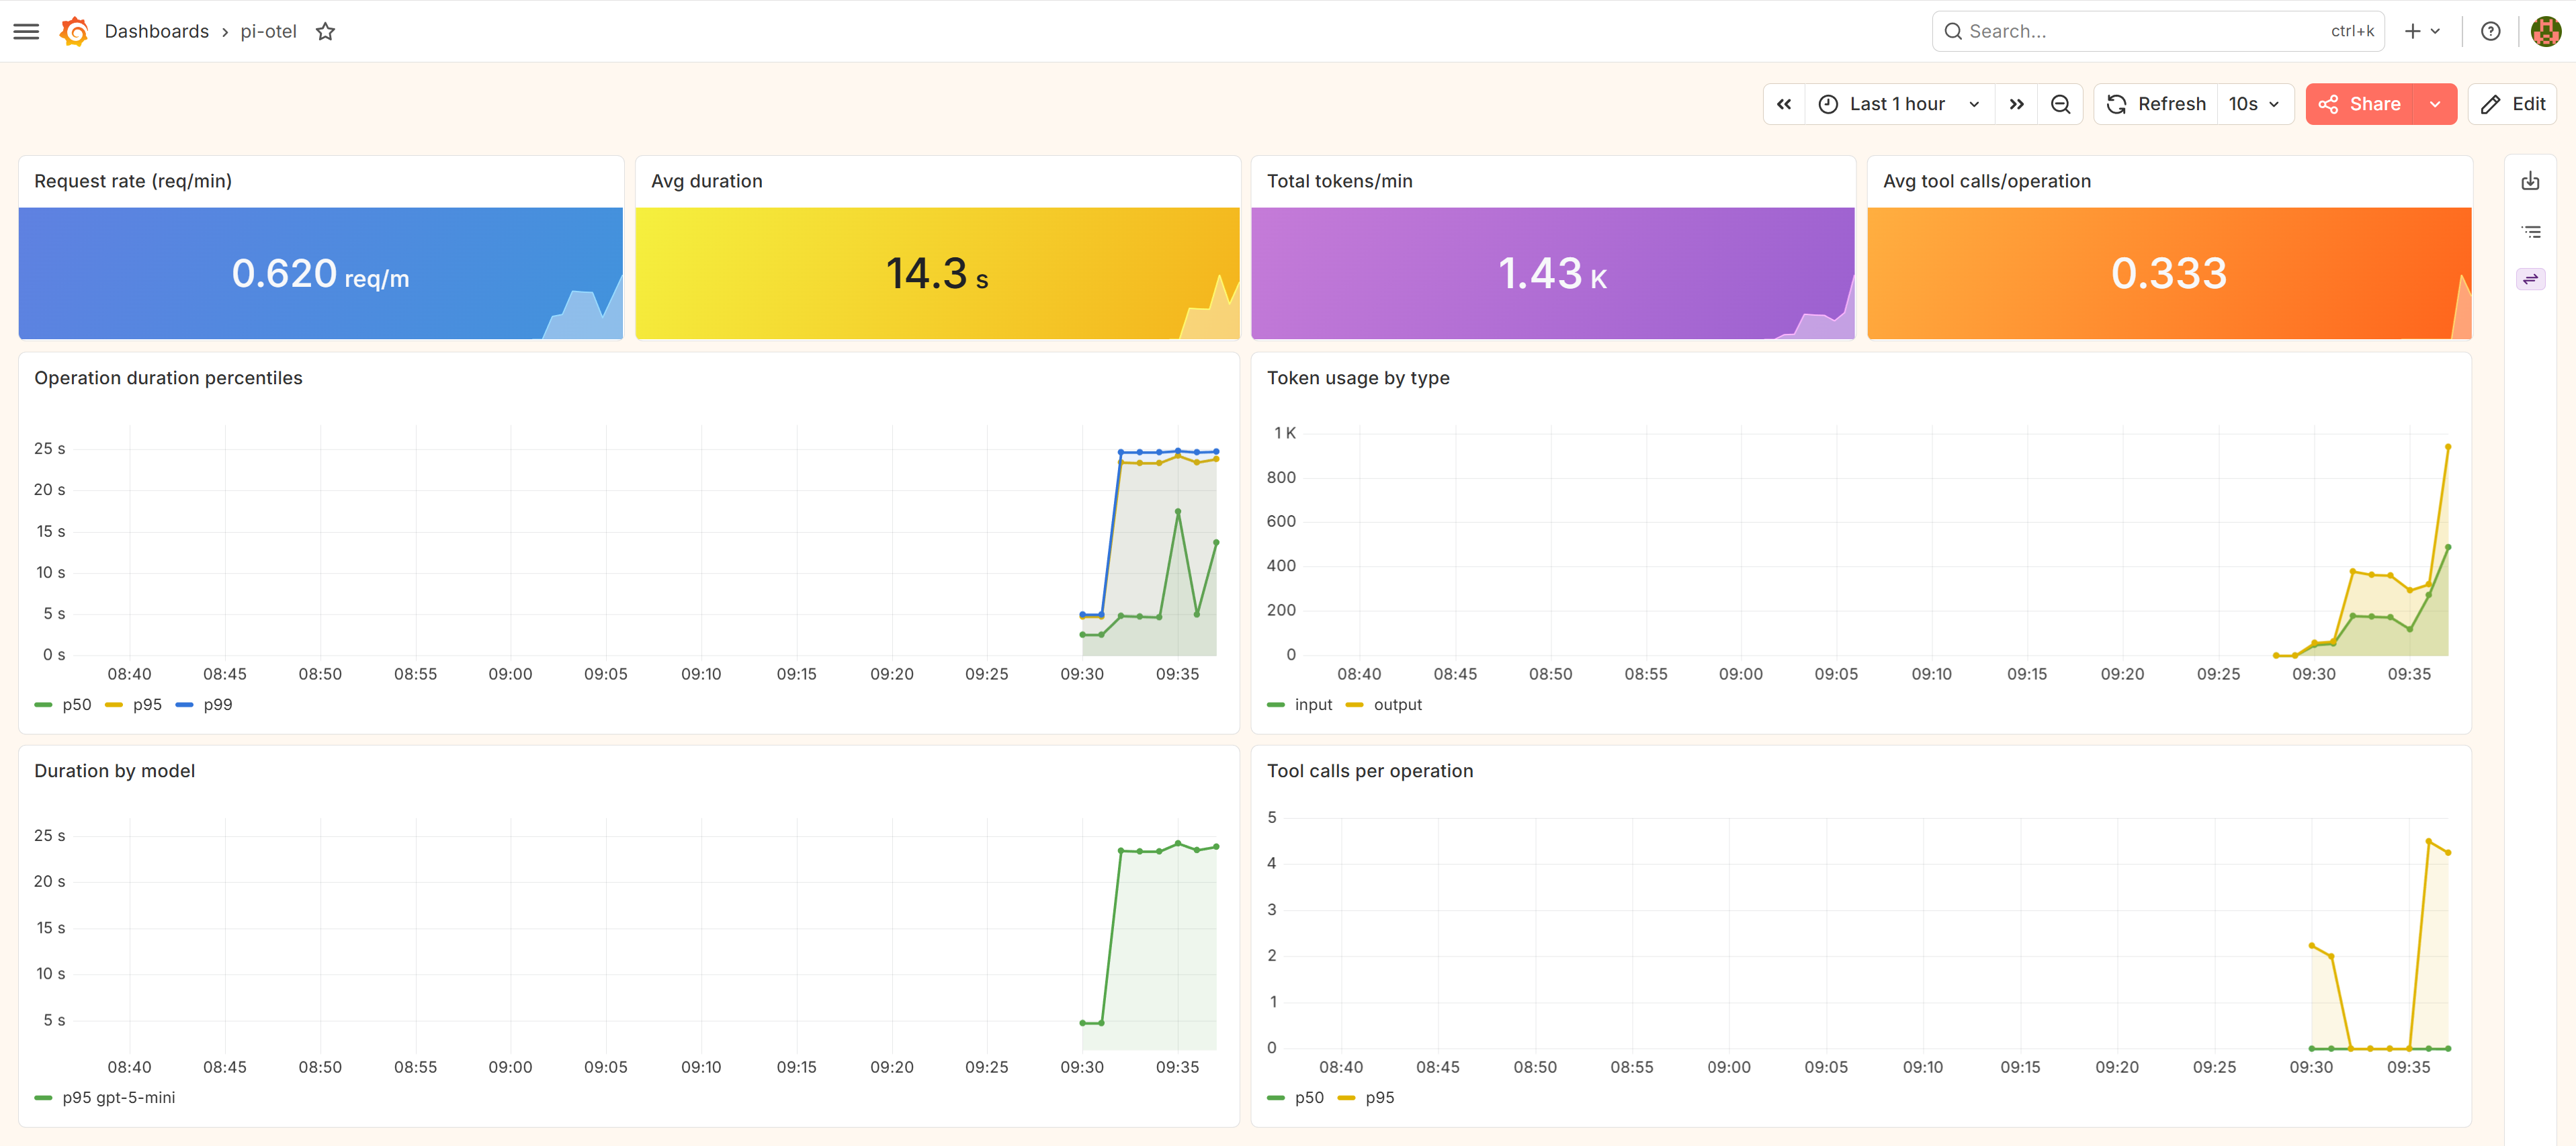
Any OTLP backend
Aspire is the default because it requires zero configuration. But pi-otel is built on open standards — the OTLP exporter works with anything.
Grafana LGTM
The samples/lgtm/ directory ships a docker-compose.yml that spins up the otel-lgtm image (Tempo + Mimir + Loki in one container):
cd samples/lgtm
docker compose up -d
Then inside pi:
/otel connect http://localhost:4317
Traces land in Tempo, metrics in Mimir/Prometheus, logs in Loki — all pre-wired to Grafana.
Other backends
For Honeycomb, Grafana Cloud, Jaeger, or any other OTLP receiver, point the endpoint and add auth headers:
// .pi/settings.json
{
  "otel": {
    "endpoint": "https://api.honeycomb.io",
    "headers": { "x-honeycomb-team": "YOUR_API_KEY" }
  }
}
Or via env vars:
OTEL_EXPORTER_OTLP_ENDPOINT=https://api.honeycomb.io
OTEL_EXPORTER_OTLP_HEADERS=x-honeycomb-team=YOUR_API_KEY
Configuration reference
// .pi/settings.json or ~/.pi/agent/settings.json
{
  "otel": {
    "enabled": true,
    "endpoint": "http://localhost:4317",
    "protocol": "grpc",
    "serviceName": "pi",
    "captureContent": "metadata_only",
    "sampleRatio": 1.0,
    "signals": { "traces": true, "metrics": false, "logs": false }
  }
}
| Key | Default | Description |
|---|---|---|
enabled |
true |
Master switch |
endpoint |
http://localhost:4317 |
OTLP receiver URL |
protocol |
grpc |
grpc, http/protobuf, or http/json
|
captureContent |
metadata_only |
Content capture mode |
sampleRatio |
1.0 |
Head sampling ratio (0.0–1.0) |
signals.traces |
true |
Emit trace spans |
signals.metrics |
false |
Emit token/cost/latency histograms |
signals.logs |
false |
Emit lifecycle log records + diag bridge |
Standard OTEL_* env vars override settings. PI_OTEL_DISABLED=1 makes the extension a complete no-op.
Content capture
By default (captureContent: "metadata_only") spans carry token counts, model names, finish reasons, and tool call IDs — but not prompt or response text. Three modes:
| Mode | What lands on spans |
|---|---|
metadata_only |
Token counts, model, finish reason, tool IDs |
no_tool_content |
+ LLM message content; no tool input/output |
full |
Everything, including tool input/output (capped at 60 KB per attribute) |
{ "otel": { "captureContent": "full" } }
Extensibility — logs from your own pi package
Since pi-otel registers a global OTel LoggerProvider at startup, any code in the same process can emit log records into the same stream. Two ways to do it:
OTel API directly — add @opentelemetry/api-logs as a dependency, call the global provider. The call is a no-op if pi-otel isn’t loaded.
import { logs, SeverityNumber } from "@opentelemetry/api-logs";

logs.getLogger("my-package", "1.0.0").emit({
  severityNumber: SeverityNumber.DEBUG,
  body: "cache hit",
  attributes: { "tool.name": "bash" },
});
pi-otel:log event bus — no import needed. From any pi extension, emit on pi’s shared event bus.
pi.events.emit("pi-otel:log", {
  eventName: "my-package.cache-hit",
  severity: "debug",
  body: "cache hit",
  attributes: { "tool.name": "bash" },
});
Both land in Aspire Structured Logs alongside pi-otel’s own session and error events. The OTel API approach uses your own instrumentation scope; the event bus emits under pi-otel.
The diagnostic bridge
When signals.logs is enabled, pi-otel forwards the @opentelemetry/* SDK’s own internal diag messages to the same OTLP endpoint under the @opentelemetry/diag instrumentation scope.
Getting started
pi install npm:pi-otel
Then in pi:
/otel start # spawn local Aspire dashboard
Full documentation: nikiforovall.blog/pi-otel/
Summary
Pi’s minimalism is a strength. pi-otel adds one thing: a timeline view of what the agent actually did, in a format that integrates with your existing observability stack. One trace tree per turn, three signals, any OTLP backend.
🙌 I hope you found it helpful. If you have any questions, please feel free to reach out. If you’d like to support my work, a star on GitHub would be greatly appreciated! 🙏
References
- Topics:
- ai (24) ·
- productivity (15) ·
- ai (32) ·
- agents (17) ·
- developer-tools (13) ·
- opentelemetry (7) ·
- observability (1)
