
TL;DR: Your workers share an API quota, and you cannot see its limit. Then another client starts to eat part of it. A fixed client-side limit is wrong in both directions. Set it high and you collect 429s. Set it low and you leave quota on the table.
Nall.RateLimiting.Adaptive sets the rate of each HttpClient from what the server sends back. I built a small Aspire app to watch this happen for real. Three workers, a k6 “noisy neighbor” and a Grafana dashboard. When the neighbor shows up, the workers back off. When I add two more workers, all five split what is left.
Source: github.com/NikiforovAll/adaptive-rate-limiting-dotnet
The problem
Many APIs hand out quota per tenant or per app, not per process. Microsoft Graph and SharePoint work this way. All your background workers draw from one pool. So does every other client in the same tenant, and you do not control those.
A fixed client-side limit looks safe until you notice the right number keeps moving:
- The neighbor is quiet. Your low limit wastes quota.
- The neighbor is busy. Your high limit turns into a stream of 429s. Each 429 still counts against the quota, and some APIs punish you longer if you keep sending.
- You add a worker. Now every worker has to take a smaller slice.
The server already tells you when you are wrong. A 429 with Retry-After says you are too fast. A success after a wait hints that you could go a bit faster. The limiter listens to both and moves the rate.
How the limiter works
The limiter is a token bucket measured in units per minute. Each request waits for its units, then the handler sends it. A rate controller decides how fast the bucket refills. This post uses AIMD, the same idea TCP uses for congestion.
- On a 429, or a 503 with
Retry-After, AIMD multiplies the rate byDecreaseFactor, 0.7 by default, and pauses the bucket until theRetry-Afterpasses. - On a success, AIMD adds
IncreaseStepto the rate, at most once perIncreaseInterval. It only does this when requests actually had to wait for units. A client that sends less than its limit does not get a bigger limit for free.
Retry-After.Down fast, up slow. That asymmetry is the whole trick.
You write the options once for the whole app. With several instances, each one takes value / instanceCount, and the increase step shrinks by the same factor. An IInstanceCountSource tells the limiter how many instances there are.
Try it in the simulator
The docs site has a simulator that runs the limiter rules in your browser. The race below sends four clients through the same “noisy neighbor” story on the same seed: no limiter, a fixed rate, AIMD and CUBIC. Two instances share 3,000 units per minute. After 5 minutes, another client takes half of it for 60 seconds. Look at the throttle counts, not only at the bars. “No limiter” gets the most units, and it pays for them with tens of thousands of 429s.
To watch one mode step by step, open the live run in the docs.
A simulator is a model, though, and models are easy to make look good. The rest of this post runs the real library against a real server.
The demo app
The sample is an Aspire app with five parts:
(+ extra-worker x2)"] -->|"X-Client: worker"| Q["quota-api
3,000 req/min"] K["neighbor (k6)"] -->|"X-Client: neighbor"| Q W <-->|heartbeat| R[(redis)] W -.->|OTLP metrics| G["grafana
(otel-lgtm)"] Q -.->|OTLP metrics| G
-
quota-apiis a minimal API with one token bucket of 3,000 requests per minute for everyone. An empty bucket means a 429 withRetry-After. No client knows the number. -
workerruns 16 loops that callGET /items/{id}as fast as the limiter allows. It has 3 replicas. -
extra-workeris the same project with 2 more replicas. It waits until you start it. -
neighboris a k6 container that sends 25 requests per second, 1,500 per minute, for 150 seconds, with no limiter at all. It also waits until you start it. -
grafanais thegrafana/otel-lgtmimage. It packs an OpenTelemetry Collector, Prometheus and Grafana into one container, and I mount the dashboard for this demo into it.
The AppHost, cut down to the parts that matter. The full file also wires the Grafana exporter and the WaitFor calls.
AppHost.cs
var grafana = builder.AddContainer("grafana", "grafana/otel-lgtm", "0.37.0"); // + endpoints, dashboard mounts
var redis = builder.AddRedis("redis");

var quotaApi = builder.AddProject<Projects.NoisyNeighbor_QuotaApi>("quota-api");

builder.AddProject<Projects.NoisyNeighbor_Worker>("worker")
    .WithReplicas(3)
    .WithReference(quotaApi)
    .WithReference(redis);

builder.AddProject<Projects.NoisyNeighbor_Worker>("extra-worker")
    .WithReplicas(2)
    .WithReference(quotaApi)
    .WithReference(redis)
    .WithExplicitStart();

builder.AddContainer("neighbor", "grafana/k6", "2.3.0")
    .WithBindMount("../k6", "/scripts", isReadOnly: true)
    .WithArgs("run", "/scripts/neighbor.js")
    .WithEnvironment("QUOTA_API_URL", quotaApi.GetEndpoint("http"))
    .WithExplicitStart();
WithExplicitStart() keeps the neighbor and the extra workers parked. You start them from the Aspire dashboard or with aspire resource <name> start, and the charts get a clean before and after.
I wanted live replica scaling here. Aspire cannot change the replica count of a running resource, so extra-worker is the workaround. It is a second resource that you switch on. It works fine, and you can still stop single replicas from the dashboard.
Telemetry goes to two places. The Aspire dashboard gets metrics, traces and logs through the usual OTEL_EXPORTER_OTLP_ENDPOINT. Grafana gets only metrics, through a second named OTLP exporter that reads GRAFANA_OTLP_ENDPOINT.
The worker
The worker code is short. Register a limiter, then put its handler on the HttpClient.
Program.cs
var builder = Host.CreateApplicationBuilder(args);

builder.AddServiceDefaults();
builder.AddRedisClient("redis");

builder.Services.AddAdaptiveRateLimiter("quota-api").WithInstanceCount<RedisInstanceCount>();
builder.Services.ConfigureOpenTelemetryMeterProvider(metrics => metrics.AddMeter(AdaptiveRateLimiterMetrics.MeterName));

builder
    .Services.AddHttpClient(
        "quota-api",
        client =>
        {
            client.BaseAddress = new Uri("https+http://quota-api");
            client.DefaultRequestHeaders.Add("X-Client", "worker");
        }
    )
    .AddAdaptiveRateLimitHandler("quota-api");

builder.Services.AddHostedService<LoadWorker>();

builder.Build().Run();
The settings describe the whole app, not one replica. InitialUnitsPerMinute: 900 with three workers means 300 each at start.
appsettings.json
{
  "AdaptiveRateLimiting": {
    "Limiters": {
      "quota-api": {
        "Controller": "Aimd",
        "InitialUnitsPerMinute": 900,
        "MinUnitsPerMinute": 300,
        "MaxUnitsPerMinute": 6000,
        "Aimd": {
          "DecreaseFactor": 0.7,
          "IncreaseStep": 360,
          "IncreaseInterval": "00:00:05"
        }
      }
    }
  }
}
How many workers share the budget?
RedisInstanceCount answers that. Every 5 seconds each worker writes a heartbeat into a Redis sorted set and drops entries older than 15 seconds. The size of the set is the count. Crude, and good enough.
RedisInstanceCount.cs
public sealed class RedisInstanceCount(IConnectionMultiplexer redis, ILogger<RedisInstanceCount> logger)
    : IInstanceCountSource
{
    private static readonly RedisKey s_key = "noisy-neighbor:workers";
    private static readonly TimeSpan s_period = TimeSpan.FromSeconds(5);
    private static readonly TimeSpan s_ttl = TimeSpan.FromSeconds(15);

    private readonly string _id = $"{Environment.MachineName}:{Environment.ProcessId}";
    private int _current = 1;

    public int Current => _current = Beat();

    public IDisposable? OnChange(Action<int> listener) =>
        new Timer(
            _ =>
            {
                try
                {
                    listener(_current = Beat());
                }
                catch (RedisException ex)
                {
                    logger.LogWarning(ex, "Redis is not available. Keep {Count} workers.", _current);
                }
            },
            null,
            s_period,
            s_period
        );

    private int Beat()
    {
        var db = redis.GetDatabase();
        var now = DateTimeOffset.UtcNow.ToUnixTimeMilliseconds();
        db.SortedSetAdd(s_key, _id, now);
        db.SortedSetRemoveRangeByScore(s_key, double.NegativeInfinity, now - s_ttl.TotalMilliseconds);
        return Math.Max(1, (int)db.SortedSetLength(s_key));
    }
}
When a worker dies, its entry expires and the others pick up its slice within 15 seconds. When Redis is down, the workers keep the last count they saw and log a warning.
Run it
$ dotnet run --project samples/NoisyNeighbor/NoisyNeighbor.AppHost \
    --launch-profile http
info: Aspire.Hosting.DistributedApplication[0]
      Aspire AppHost version: 13.6.1
info: Aspire.Hosting.DistributedApplication[0]
      Now listening on: http://localhost:15180
info: Aspire.Hosting.DistributedApplication[0]
      Distributed application started. Press Ctrl+C to shut down.
In the Aspire dashboard, click the link on the grafana resource. It opens the “Noisy neighbor” dashboard directly.
1. Steady state: three workers find the quota
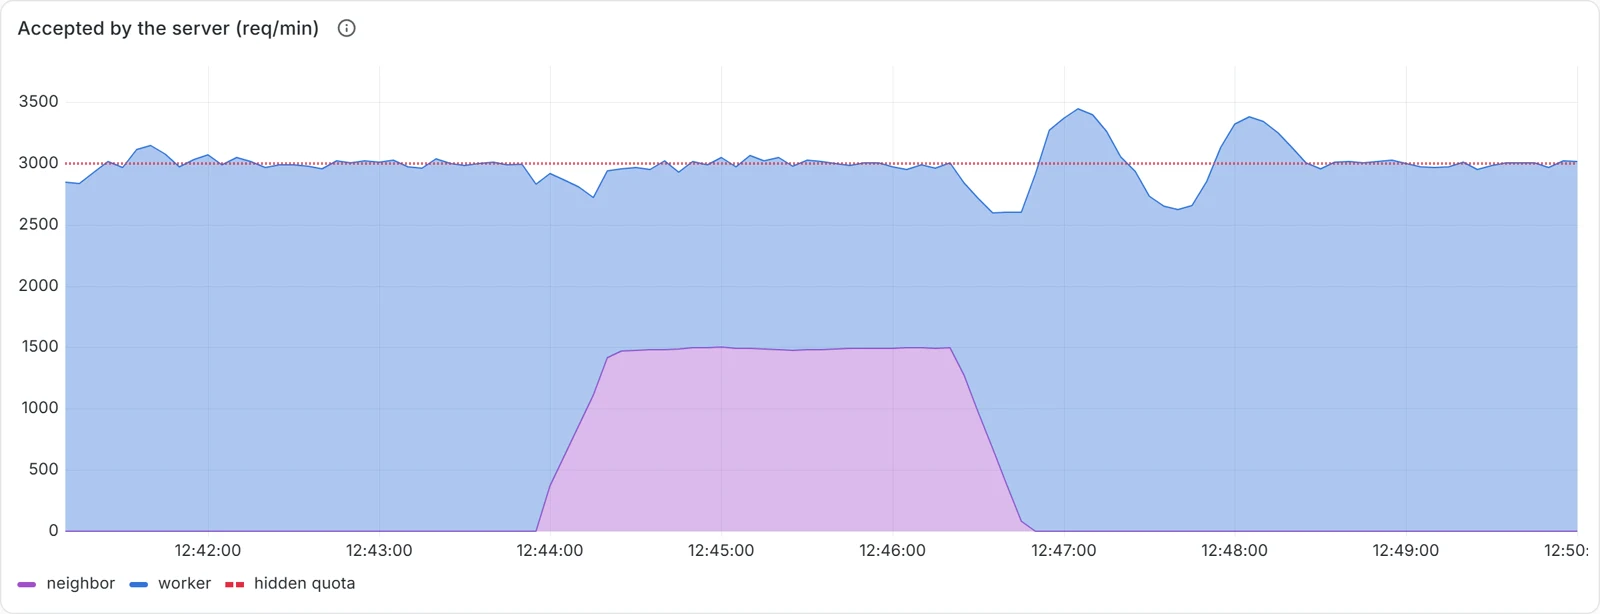
Each worker starts at 300 units per minute and climbs by 120 every 5 seconds. Within a minute the sum passes 3,000 and the first 429s arrive. After that the rates saw up and down around the quota. Between 12:41:30 and 12:43:45 the server accepted about 3,010 worker requests per minute and sent 19 429s in total. That is one throttle every 7 seconds for three workers, and it is the price of finding a limit nobody tells you.
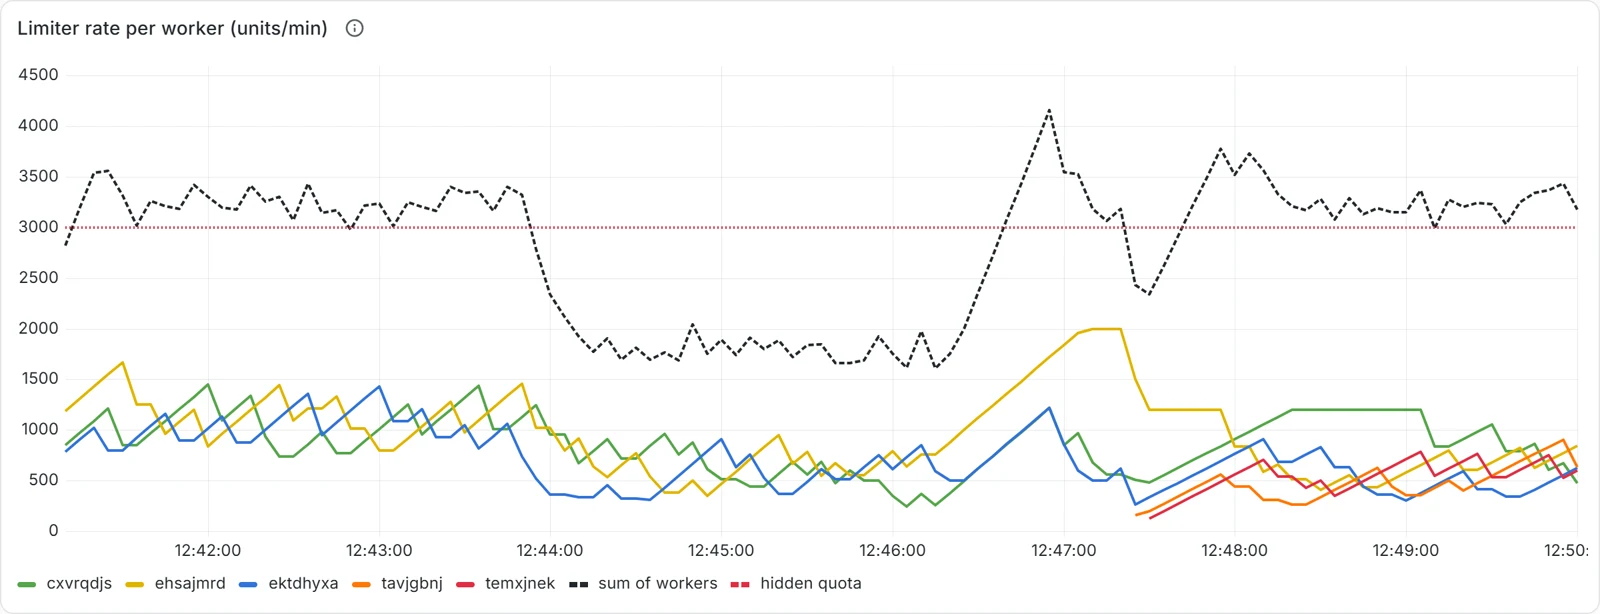
The sum stays a little above 3,000, at about 3,230. That is not waste. The limiter rate is a ceiling, and the workers do not use all of it all the time.
2. The neighbor starts
$ aspire resource neighbor start
Scanning for running AppHosts...
Starting resource 'neighbor'...
✅ Resource 'neighbor' started successfully.
The neighbor sends 1,500 requests per minute and ignores every 429. The workers see the throttles and back off. In about 30 seconds the limiter sum drops from 3,200 to 1,800, about 600 per worker. Between 12:44:30 and 12:46:15 the server accepted 1,490 neighbor requests and 1,508 worker requests per minute. The quota split in half, and nobody had to change a setting.
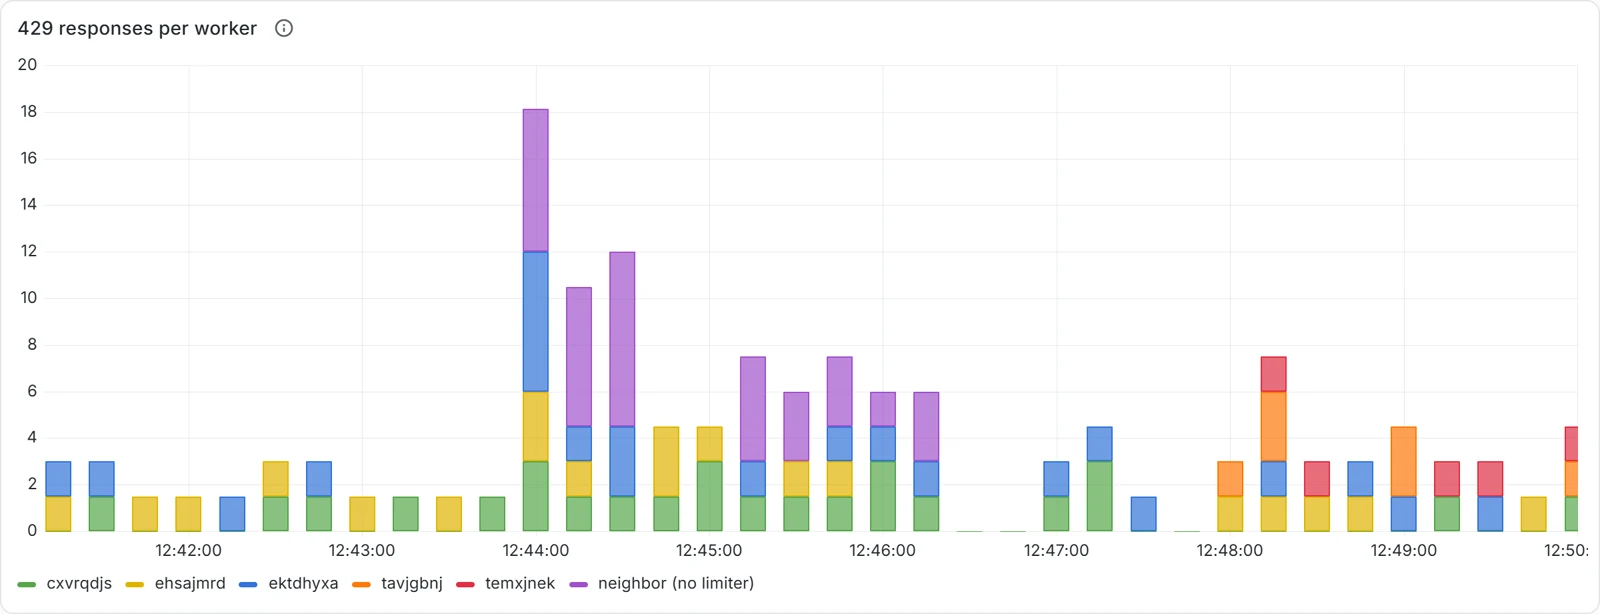
The 429s tell the same story. There is one tall bar at 12:44, when the workers still run at full speed into a half-empty bucket. Then the bars get short again. The workers took 26 429s in those 105 seconds and the neighbor took 17.
k6 prints its summary to the neighbor’s console log when the run ends. 99% of its requests got through. http_req_failed is 0% because the script marks 429 as an expected status with http.expectedStatuses(200, 429). The accepted (200) check counts the 38 throttles instead.
k6 summary
  █ TOTAL RESULTS

    checks_total.......: 3751    25.000886/s
    checks_succeeded...: 98.98% 3713 out of 3751
    checks_failed......: 1.01%  38 out of 3751

    ✗ accepted (200)
      ↳  98% — ✓ 3713 / ✗ 38

    HTTP
    http_req_duration..: avg=31.79ms min=724.69µs med=32.61ms max=82.87ms
                         p(90)=41.53ms p(95)=42.07ms
    http_req_failed....: 0.00%  0 out of 3751
    http_reqs..........: 3751   25.000886/s

    EXECUTION
    vus_max............: 50

    NETWORK
    data_received......: 628 kB
    data_sent..........: 409 kB

neighbor ✓ [ 100% ] 000/050 VUs  2m30s  25.00 iters/s
When the neighbor stops, the workers climb back. AIMD overshoots for a moment: the sum touches 4,000 at 12:47 and the server accepts about 3,260 worker requests per minute until the next 429s pull it down.
3. Scale out to five workers
$ aspire resource extra-worker-tavjgbnj start
Scanning for running AppHosts...
Starting resource 'extra-worker-tavjgbnj'...
✅ Resource 'extra-worker-tavjgbnj' started successfully.
$ aspire resource extra-worker-temxjnek start
Scanning for running AppHosts...
Starting resource 'extra-worker-temxjnek'...
✅ Resource 'extra-worker-temxjnek' started successfully.
One catch with the CLI. A resource with replicas has no single process to start, so aspire resource extra-worker start answers that the resource is not found. You start each replica by its instance name. aspire describe --format json lists them.
The heartbeat set grows from 3 to 5 at about 12:47:30, and every worker now divides the budget by 5.
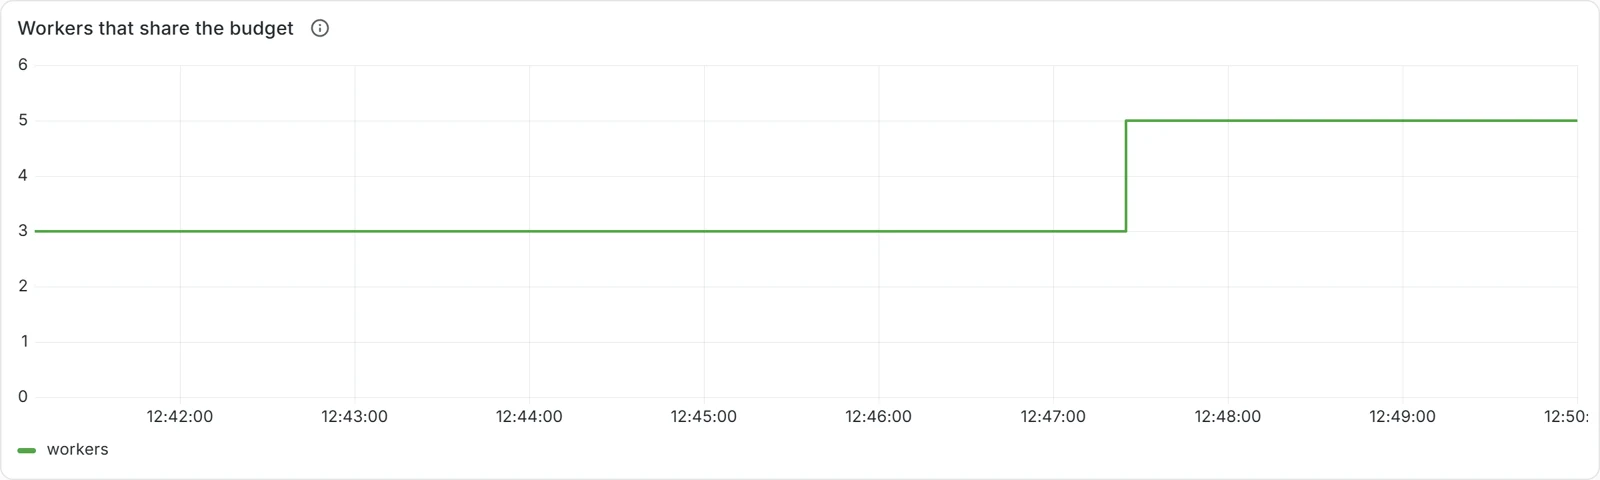
The two new workers start low, at about 200 units per minute, and climb. The three old ones come down at the same time, so the rates even out in about two minutes. Between 12:48:15 and 12:49:45 the server accepted 3,002 requests per minute from five workers and sent 19 429s, the same as three workers in steady state. More workers did not mean more throttling.
The whole run
Nine minutes on one dashboard: steady state, the neighbor, the overshoot after it leaves, and the scale-out.
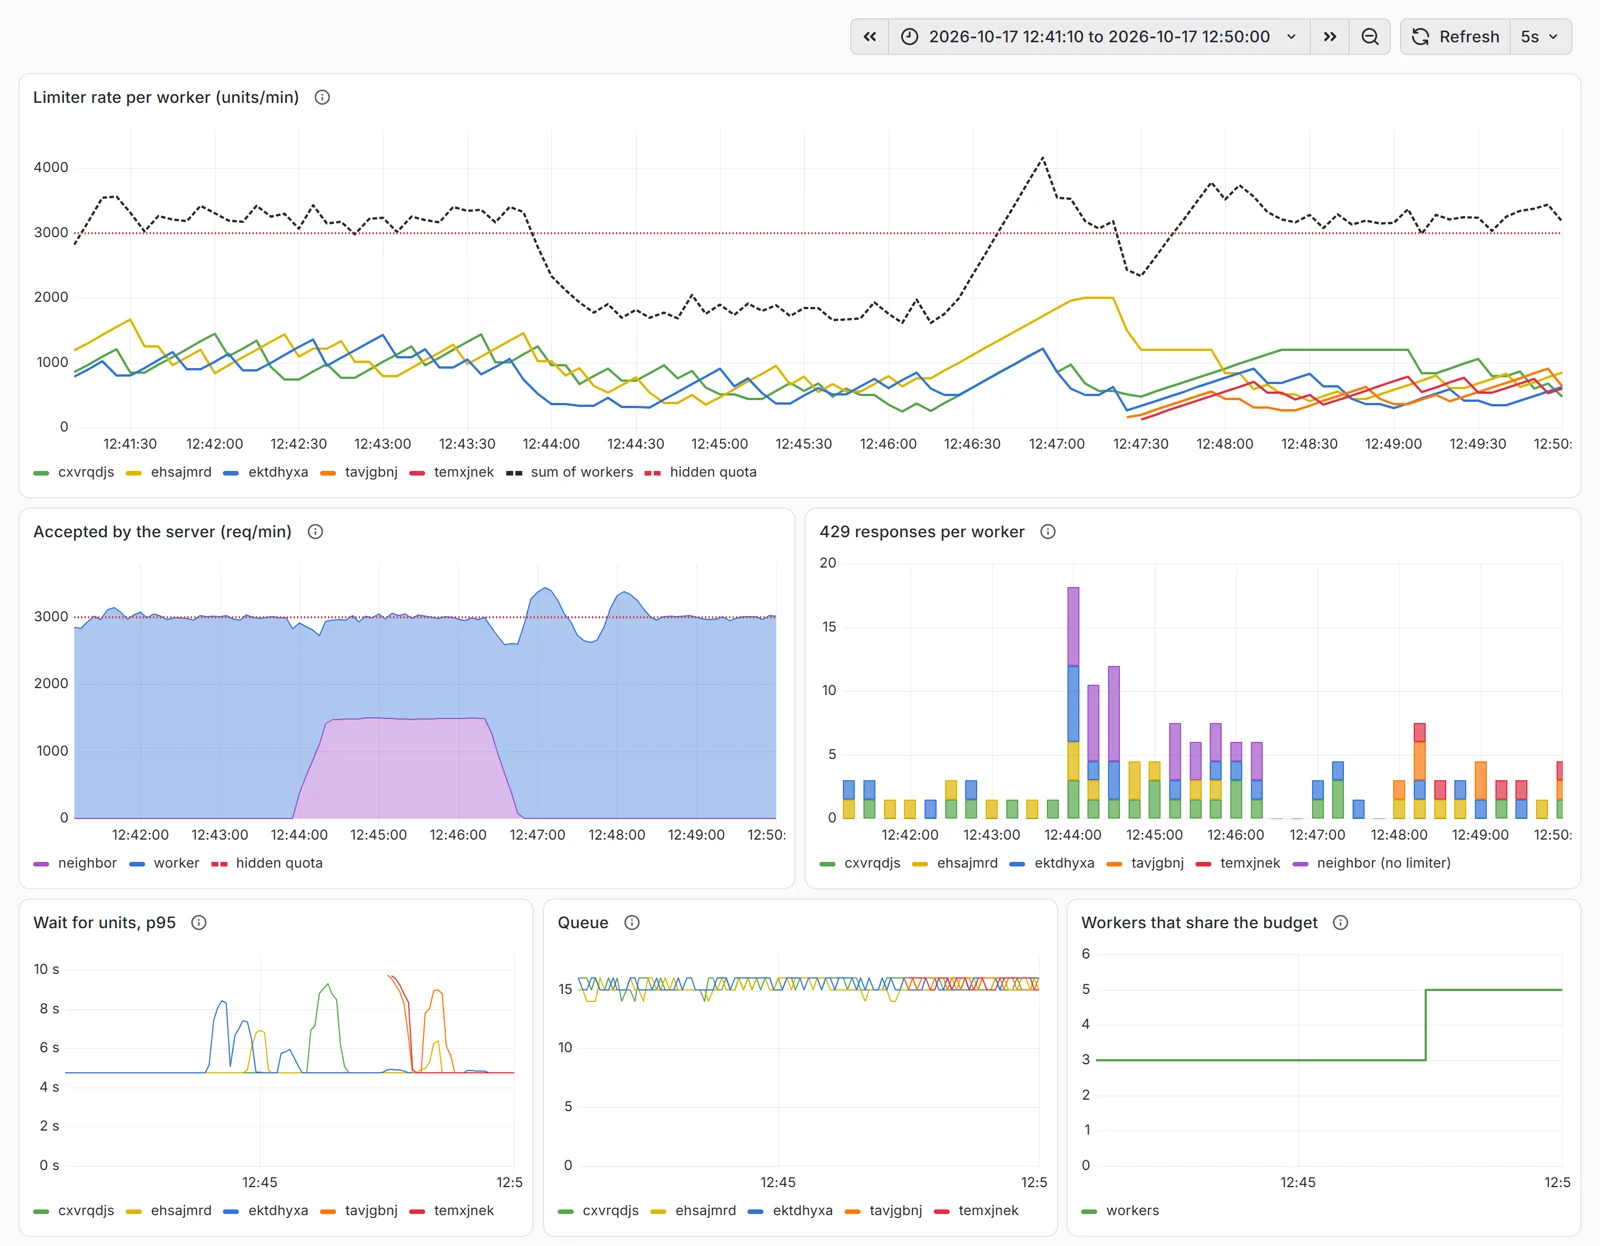
grafana/otel-lgtm, 12:41 to 12:50.Summary
A fixed client-side limit is right for exactly one load. A shared quota moves every time a neighbor wakes up or you add a worker, so the number you tuned last week is already wrong.
Nall.RateLimiting.Adaptive reads the 429s and the successes and moves the rate of each HttpClient. With AIMD the workers drop hard on a throttle and creep back up. An IInstanceCountSource, here a Redis heartbeat, splits one budget across instances, so a new worker makes everyone take a bit less.
Reference
- Topics:
- dotnet (71) ·
- dotnet (72) ·
- aspire (24) ·
- httpclient (1) ·
- rate-limiting (1) ·
- opentelemetry (8) ·
- grafana (1) ·
- k6 (1)
